Breaking Down Barriers - Part 6: Experimenting With Overlap and Preemption
This is Part 6 of a series about GPU synchronization and preemption. You can find the other articles here:
Part 1 - What’s a Barrier?
Part 2 - Synchronizing GPU Threads
Part 3 - Multiple Command Processors
Part 4 - GPU Preemption
Part 5 - Back To The Real World
Part 6 - Experimenting With Overlap and Preemption
In the previous art_icl_es we took a look at how barriers typically work on GPUs, and then we examined how multiple hardware queues can help with preemption and overall throughput. We then spent some time looking at the support for preemption and multiple queues in actual desktop video cards, and also exploring how they end up getting exposed via DX12 and the Windows 10 driver stack. To help tie everything together, I’m now going to show some results that I gathered from running a test DX12 application on a GPU from each of the major desktop IHV’s. Before I begin, I’d like to urge anyone reading this to take the results with a grain of salt. My test application gathers its timings in a rather unorthodox manner (which I’ll explain shortly), and so I can’t guarantee their accuracy with 100% certainty. It’s also very possible that some of the results here could change with future hardware or driver revisions, so please consider the full context when examining the data.
The Test App
Before I wrote these articles, I decided that it would be fun and educational to examine how different GPU’s respond to the explicit synchronization and multi-queue functionality offered by DX12. Unfortunately, I found it was rather difficult to do this in practice. The IHV’s have some vendor-specific tools for gathering timing data from an offline capture, but they’re not really set up to easily show you the degree to which different workloads were overlapping on the GPU. PIX for Windows has the ability to show overlapping draws or dispatches in its timeline view, but at the time it also wasn’t available yet. It also doesn’t currently show overlapping work from compute queues, and it can only show you timing during an offline analysis process. (AMD now has a really awesome GPU profiler that only shows you overlapping work on the GPU, but also shows you what the GPU is doing in response to barriers! Unfortunately I wrote the test app and blog post back in January of 2017, and RGP didn’t come out until July of that year).
After getting frustrated at my available options, I decided to try my hand at building my own timing system. D3D12 does have a built-in mechanism for tracking GPU execution timings via timestamp queries, which are useful for getting very coarse-grained timing data (for instance, overall GPU frame time, or the time required to complete all opaque draw calls). However they’re pretty useless when it comes to determining thread-level parallelism on the GPU. This is because it’s not specified how timestamps behave with regards to barriers and synchronization. The documentation says nothing about whether a timestamp should wait for all previous draws/dispatches to complete, or whether they should be affected by transition barriers. This means you wrap a draw call with timestamps, you don’t know if the second timestamp will record as soon as the command processor kicks of the draw or if it will record after the draw call is finished. In practice I’ve seen varying behavior from different vendors: in some cases a timestamp would cause a sync point, in others it wouldn’t. This all lead me to my “screw it, I’ll build my own timers” moment.
Fortunately, making my own shader timer wasn’t too difficult…or at least for my use case, which was a toy application where I was willing to bend the rules a bit. Really all I needed was for a shader to write to some bit of CPU-accessible memory at the start and end of the program, and I could have the CPU monitor that memory and record the timestamp. To do this I needed to use a custom heap that had the exact properties that I wanted:
D3D12_HEAP_DESC heapDesc = { };
heapDesc.SizeInBytes = 128 * 1024;
heapDesc.Flags = D3D12_HEAP_FLAG_ALLOW_ONLY_BUFFERS;
heapDesc.Alignment = 0;
heapDesc.Properties.CPUPageProperty = D3D12_CPU_PAGE_PROPERTY_WRITE_COMBINE;
heapDesc.Properties.CreationNodeMask = 0;
heapDesc.Properties.MemoryPoolPreference = D3D12_MEMORY_POOL_L0;
heapDesc.Properties.Type = D3D12_HEAP_TYPE_CUSTOM;
heapDesc.Properties.VisibleNodeMask = 0;
DXCall(DX12::Device->CreateHeap(&heapDesc, IID_PPV_ARGS(&workload.ReadbackHeap)));
The important bits here are the CPUPageProperty, and the MemoryPoolPreference. Setting the page property to WRITE_COMBINE ensures that the memory is uncached from the CPU point of view, which is important since the GPU will be writing to that memory and not a CPU core. Using MEMORY_POOL_L0 also ensures that the heap will live in system memory (as opposed to device memory on the video card), which means that the CPU can access it. It also makes it more likely that the heap will be uncached from the point of view of the GPU. If the GPU writes to an internal cache instead of directly to memory, it’s likely that the CPU wouldn’t see the write until the cache line was evicted. In the end this hopefully gives us coherent, but slow communication between the GPU and CPU.
The other key component of making this work was figuring out a way have the first thread write its value to the “start” buffer, and having the last thread write its value to the “end” buffer. The API doesn’t make any guarantees about the order in which threads are executed for a dispatch or draw call, so I didn’t want to rely on SV_DispatchThreadID or SV_Position to determine the first or last invocation. Instead, I used atomics on a global counter buffer to figure out an ordered index for each thread:
uint prevValue = 0;
CounterBuffer.InterlockedAdd(0, 1, prevValue);
if(prevValue == 0)
    ShaderStartBuffer[0] = CBuffer.FrameNum;

// Do actual shader workload

if(prevValue + 1 == CBuffer.NumWorkloadElements)
    ShaderEndBuffer[0] = CBuffer.FrameNum;
I wrote the frame number in the start/end buffers so that they would be monotonically increasing counters, thus avoiding the need to clear them frame.
The general process for timing a single frame’s workload goes like this:
- Issue a command to clear the CounterBuffer to 0 using ClearUnorderedAccessViewUint
- Issue draw/dispatch command
- Draw UI to the back buffer
- Tell the direct queue to wait on a fence that we’ll use to tell the GPU to wait for our signal before starting the GPU work from our commands
- Submit command list on the direct queue
- Present
- (Next frame)
- Wait for the last present to finish using a swap chain waitable object (this lines up the CPU thread with the end of VSYNC)
- Signal the fence that lets the GPU start the work that was submitted last frame
- Loop and check the value of the start buffer, and record the time when it changes
- Loop and check the value of the end buffer, and record the time when it changes
- Issue commands for the next frame
The good news is that it worked! After implementing and testing, the resulting timing values seemed plausible and also roughly matched the values measured by timestamp queries (I also checked against PIX later on once it was available, and it confirmed my results). From there, I added a simple framework for adding a series of dispatch and draw calls on both the DIRECT and COMPUTE queues. I also added some settings that allow the user to enable/disable workloads, configure the amount of threads launched per workload as well as the amount of per-thread work performed, and also specify dependencies that end up getting expressed as transition barriers. Here’s what the UI ends up looking like:

Under the per-workload settings, the “Num Groups” slider controls how many threads are launched per workload, in increments of 1024. For compute workloads this just controls the dispatch size, while for graphics workloads it adjusts the viewport size to indirectly specify the number of pixel shader invocations. The “Num Iterations” slider specifies the inner loop count inside of the shader program. The loop body simulates an actual workload by computing some perlin noise using an input and output buffer.
Over by the application settings window, there’s a few global settings available. VSYNC can be enabled or disabled, and a slider lets you zoom in on the timeline. The “Use Split Barriers” setting will cause the app to use split transition barriers instead of standard transition barriers to resolve dependencies. The “begin” barrier is issued immediately after issuing the draw/dispatch that’s being depended on, and the “end” barrier is issued just before the draw/dispatch that has the dependency (if split barriers are disabled, the single transition barrier is issued immediately before the draw/dispatch with the dependency). There’s also a setting to toggle a stable power state to get consistent GPU clocks, as well as a setting the causes compute queue workloads to be submitted on a queue that was created with D3D12_COMMAND_QUEUE_PRIORITY_HIGH.
Results
I tested my app on the 4 GPU’s that I have available on my home PC: and Nvidia Titan V (Volta), an Nvidia GTX 1070 (Pascal), an AMD RX 460 (Polaris, GCN Gen 4), and the Intel HD Graphics 530 that’s integrated into my Core i7 6700K CPU (Gen9, Skylake). I also tested on a GTX 980 in my work PC. For each GPU I adjusted the number of threads launched per workgroup to attempt to account for differences in the number of execution units on each GPU. All Nvidia GPU’s used 8k threads per workgroup, the RX 460 used 4k, and the Intel GPU used 2k. These are the scenarios that I used for testing:
- Default - default settings for the app. All workloads enabled, with dependencies between sequential workloads on the same queue. This shows how well DIRECT/COMPUTE submissions can overlap with separate dependency chains.
- No Barriers - all barriers are disabled, which shows how well workloads from the same queue can overlap
- Three Dispatches - three dispatches are submitted on the DIRECT queue, with the third dispatch depending on the first dispatch. The second dispatch is longer than the first dispatch, which shows sync granularity from barriers.
- Three Dispatches, Split Barrier - same as the above, except a split barrier is used. This can show whether the driver/GPU can use take advantage of split barriers to increase workload overlap for this particular case.
- High-Priority Compute - same as Default, except that the compute queue workloads are submitted on a high-priority COMPUTE queue.
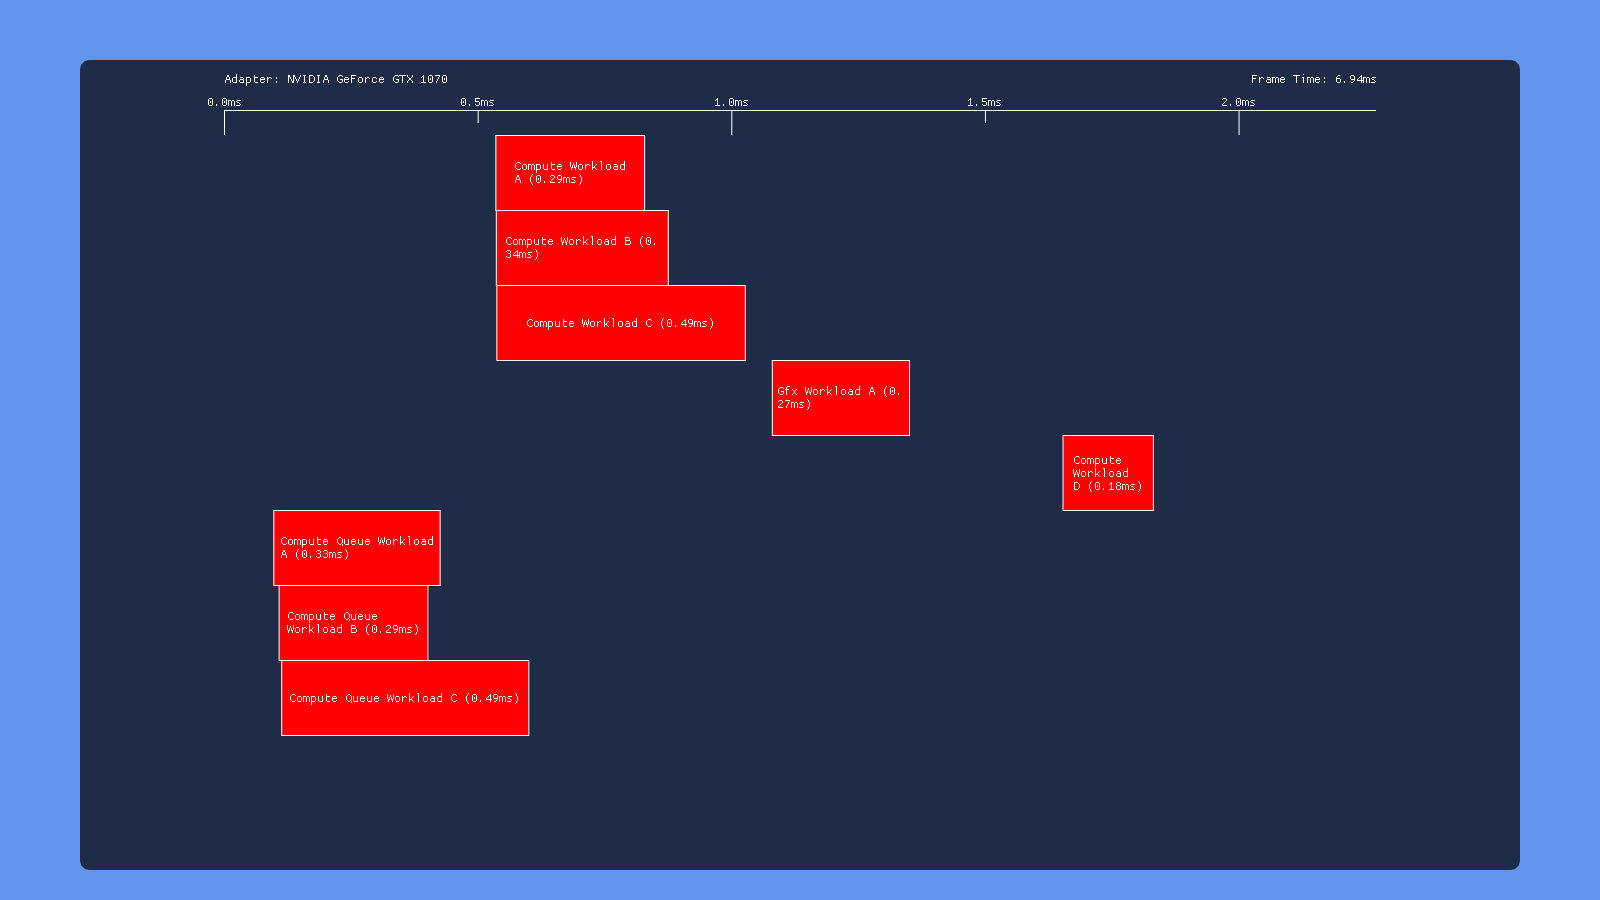
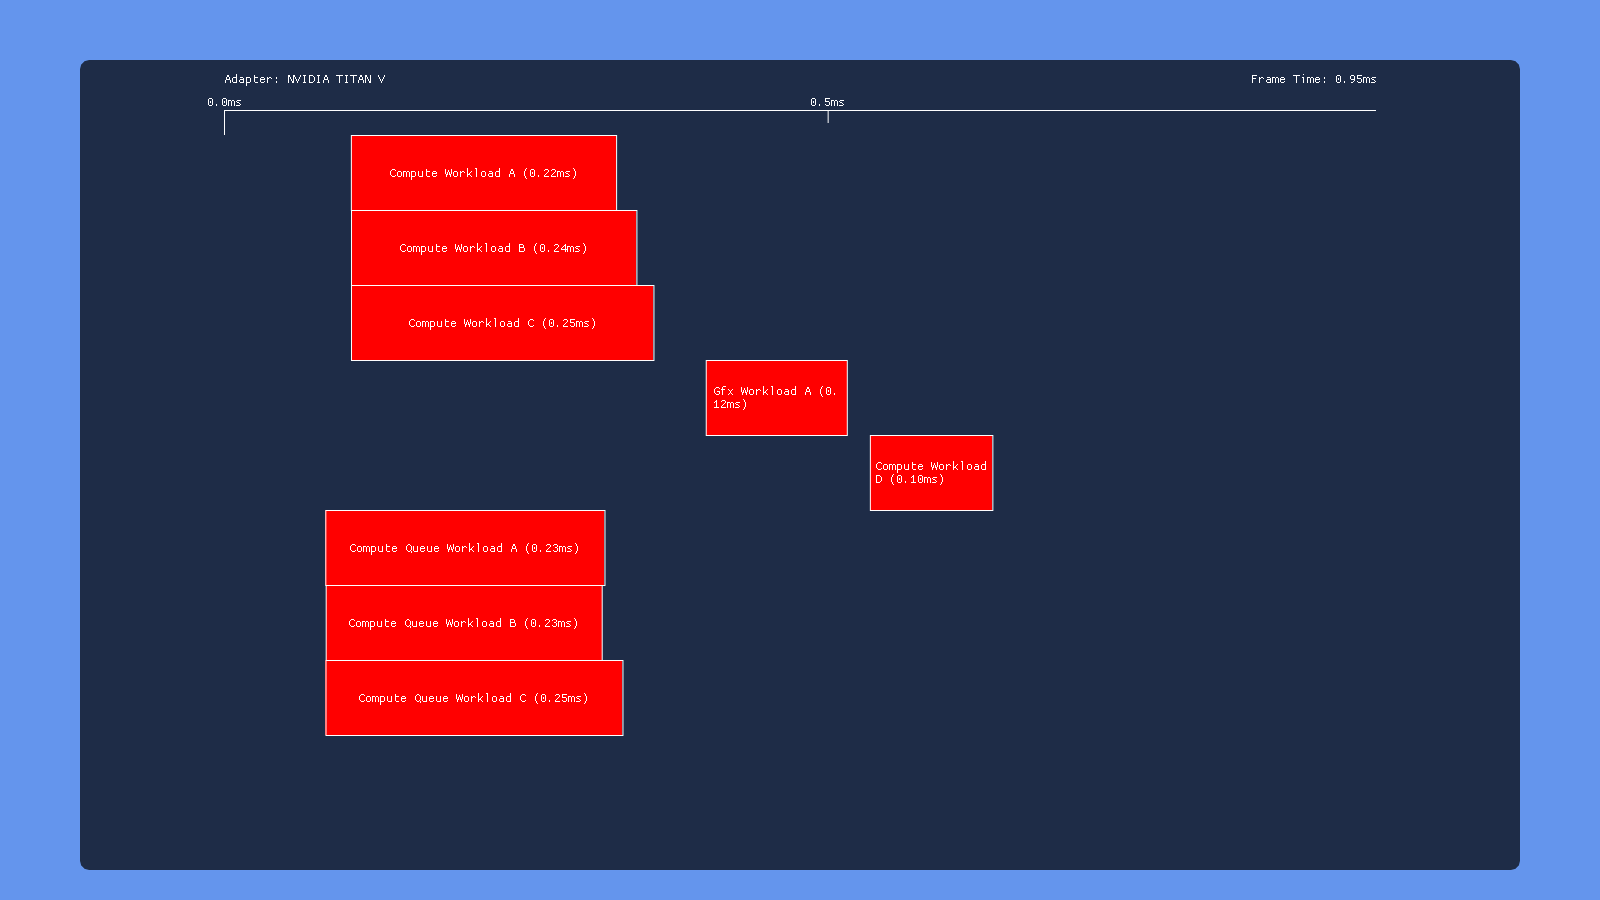
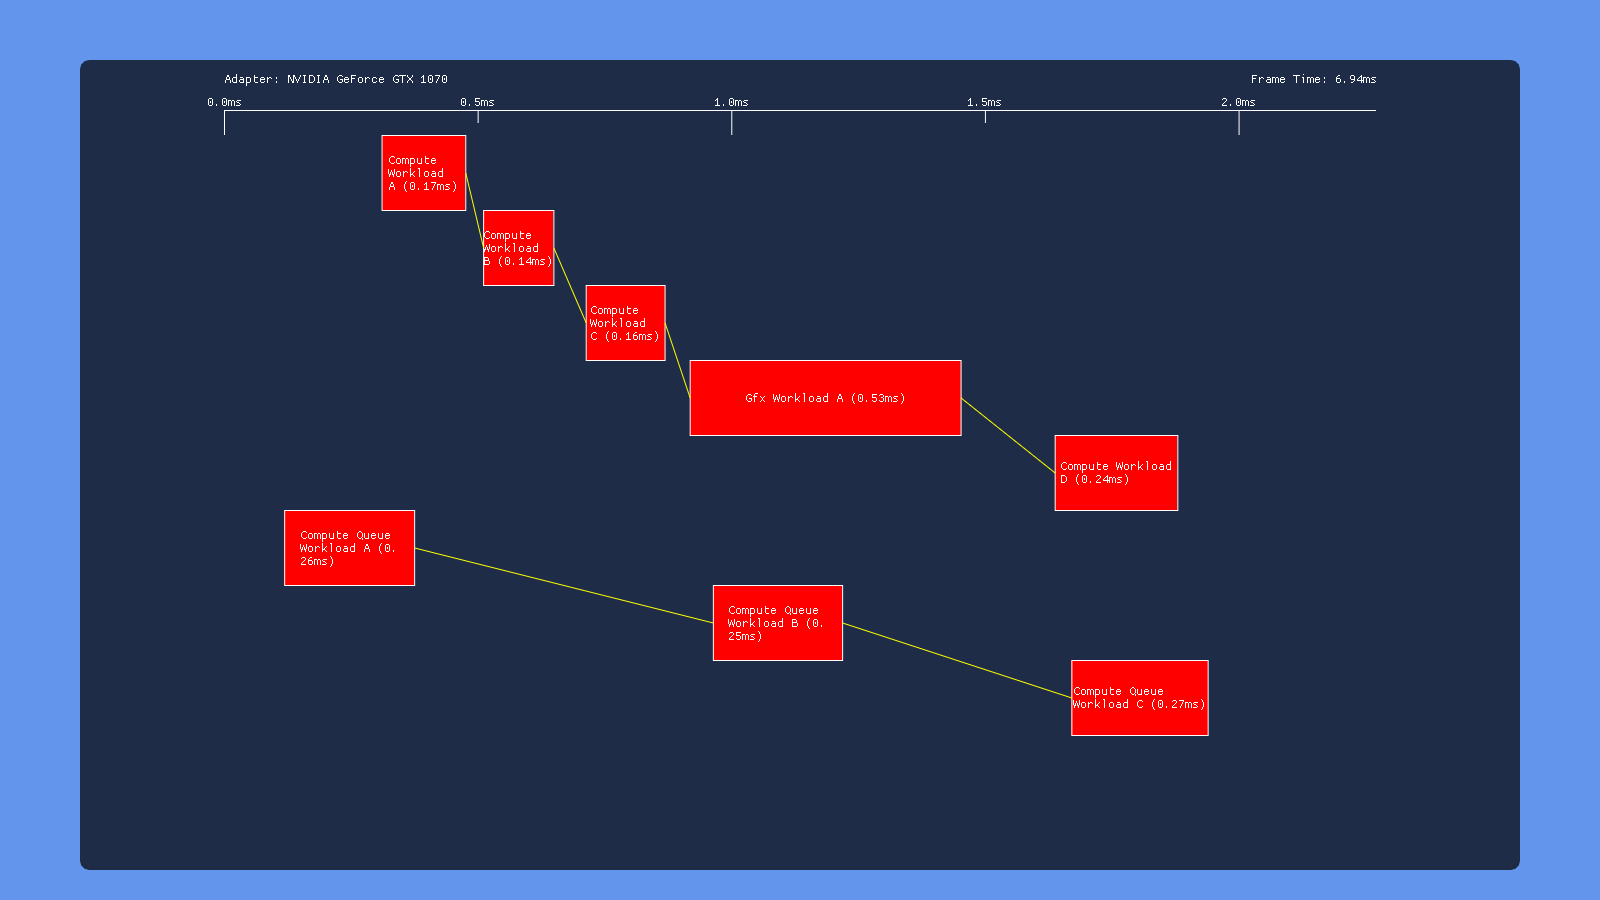
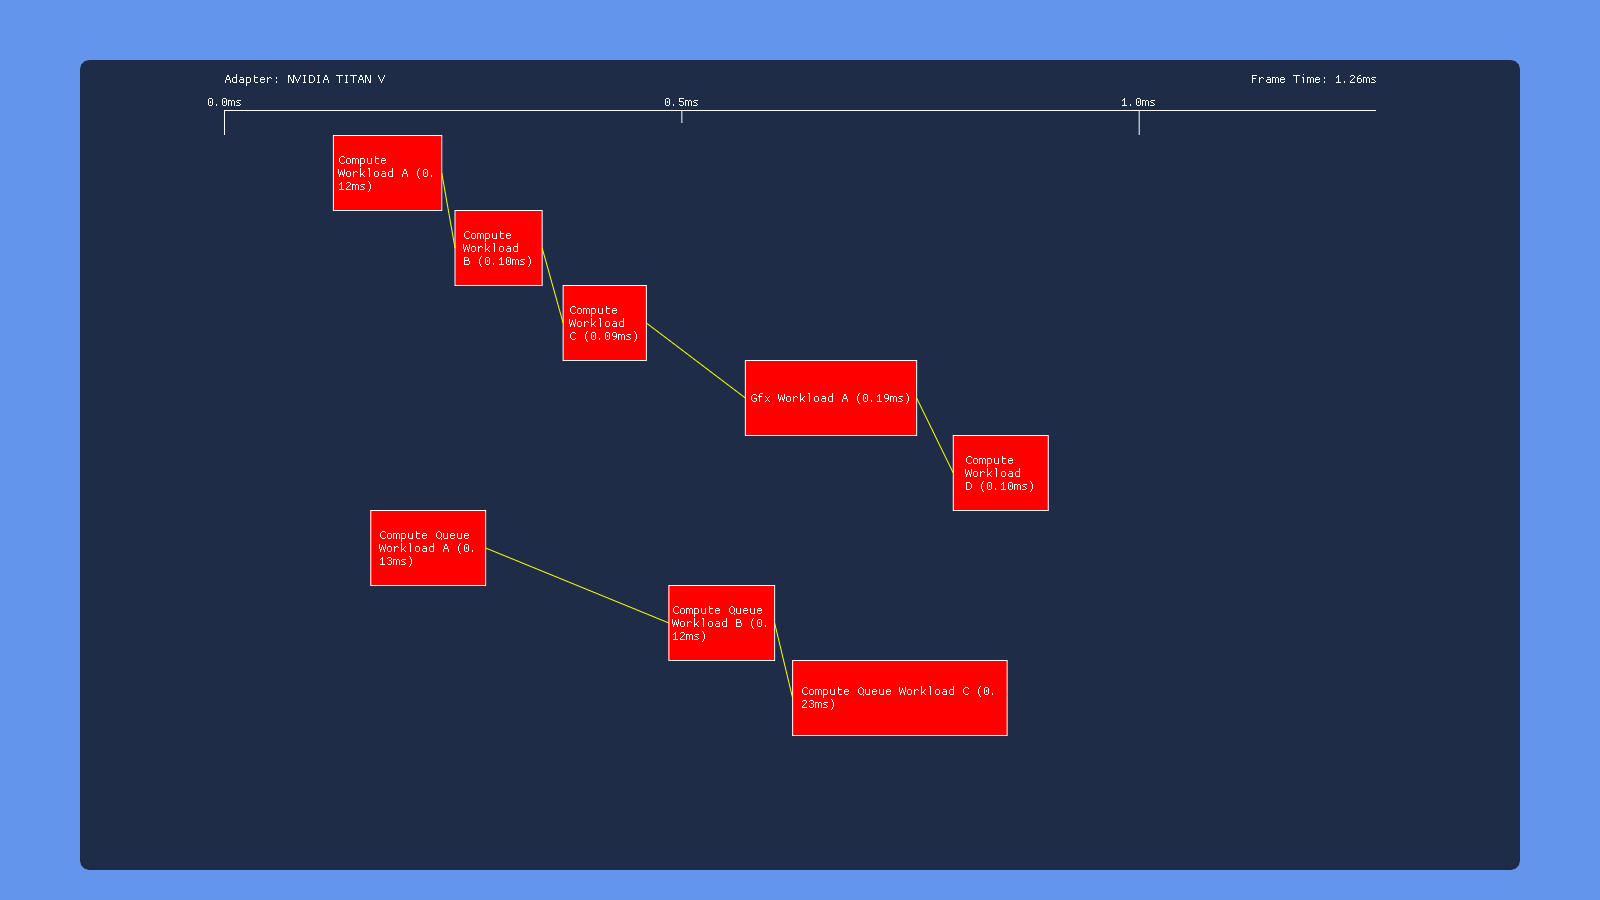
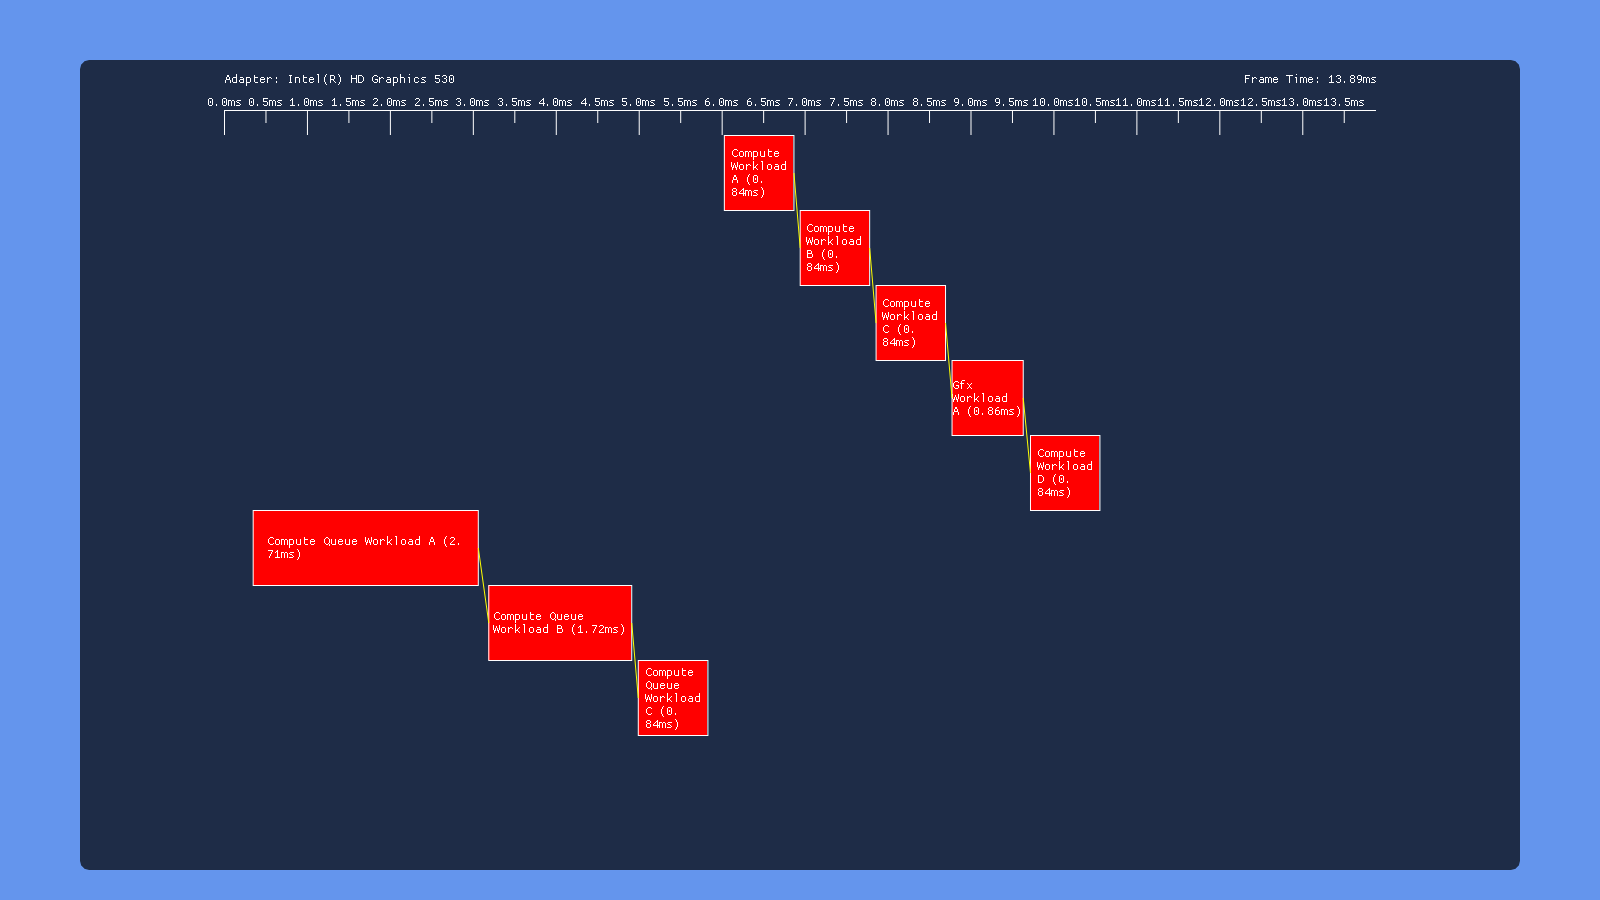
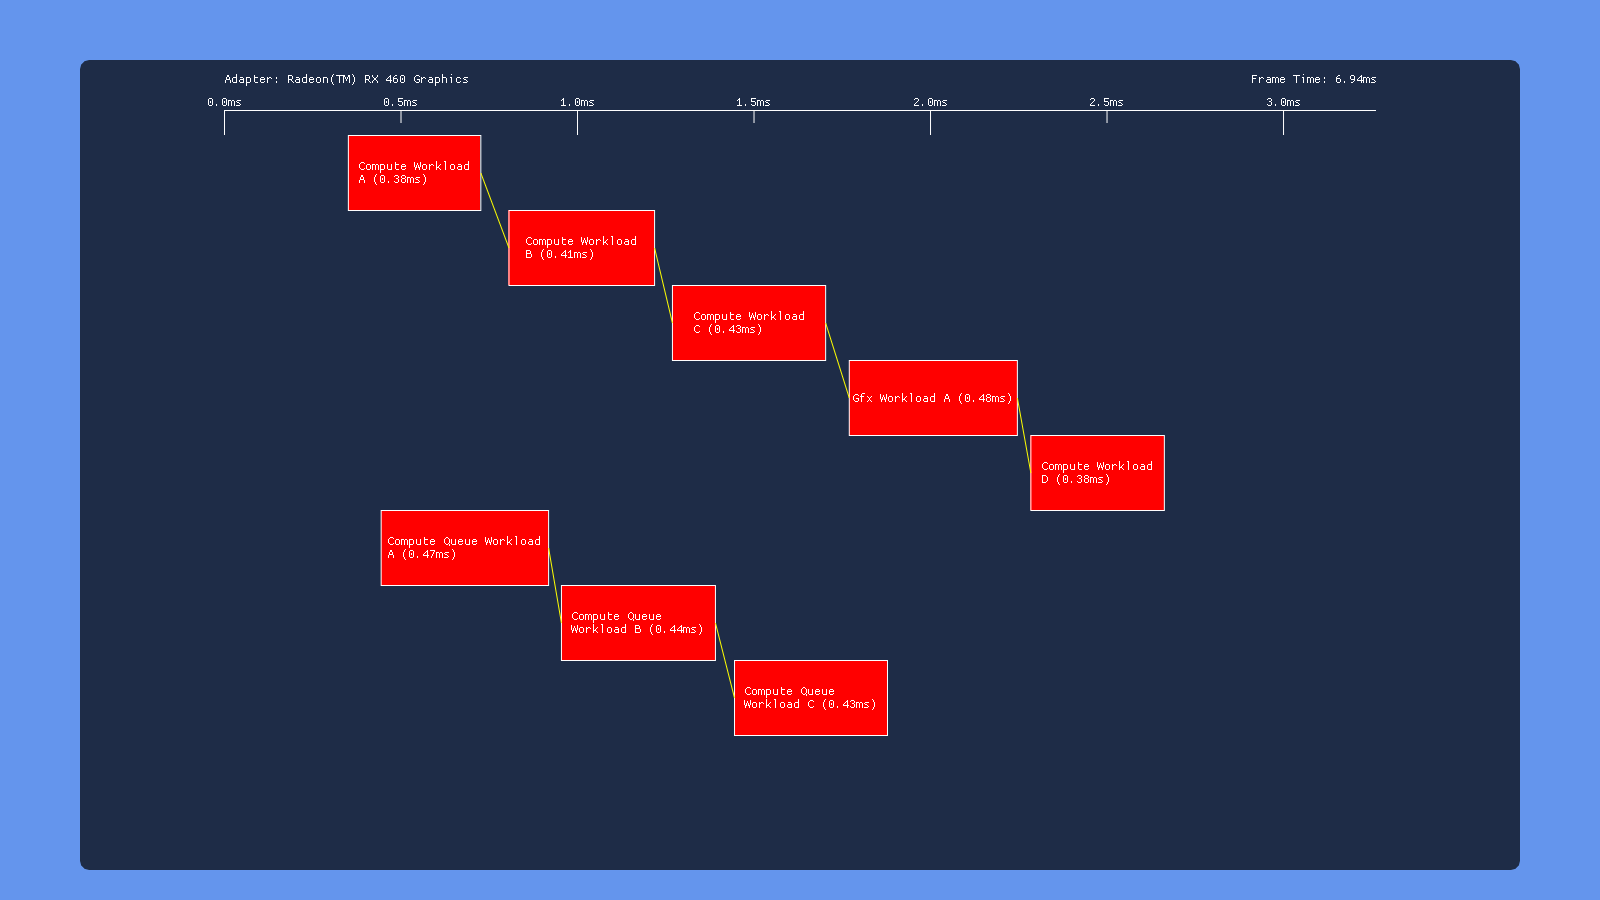
Default
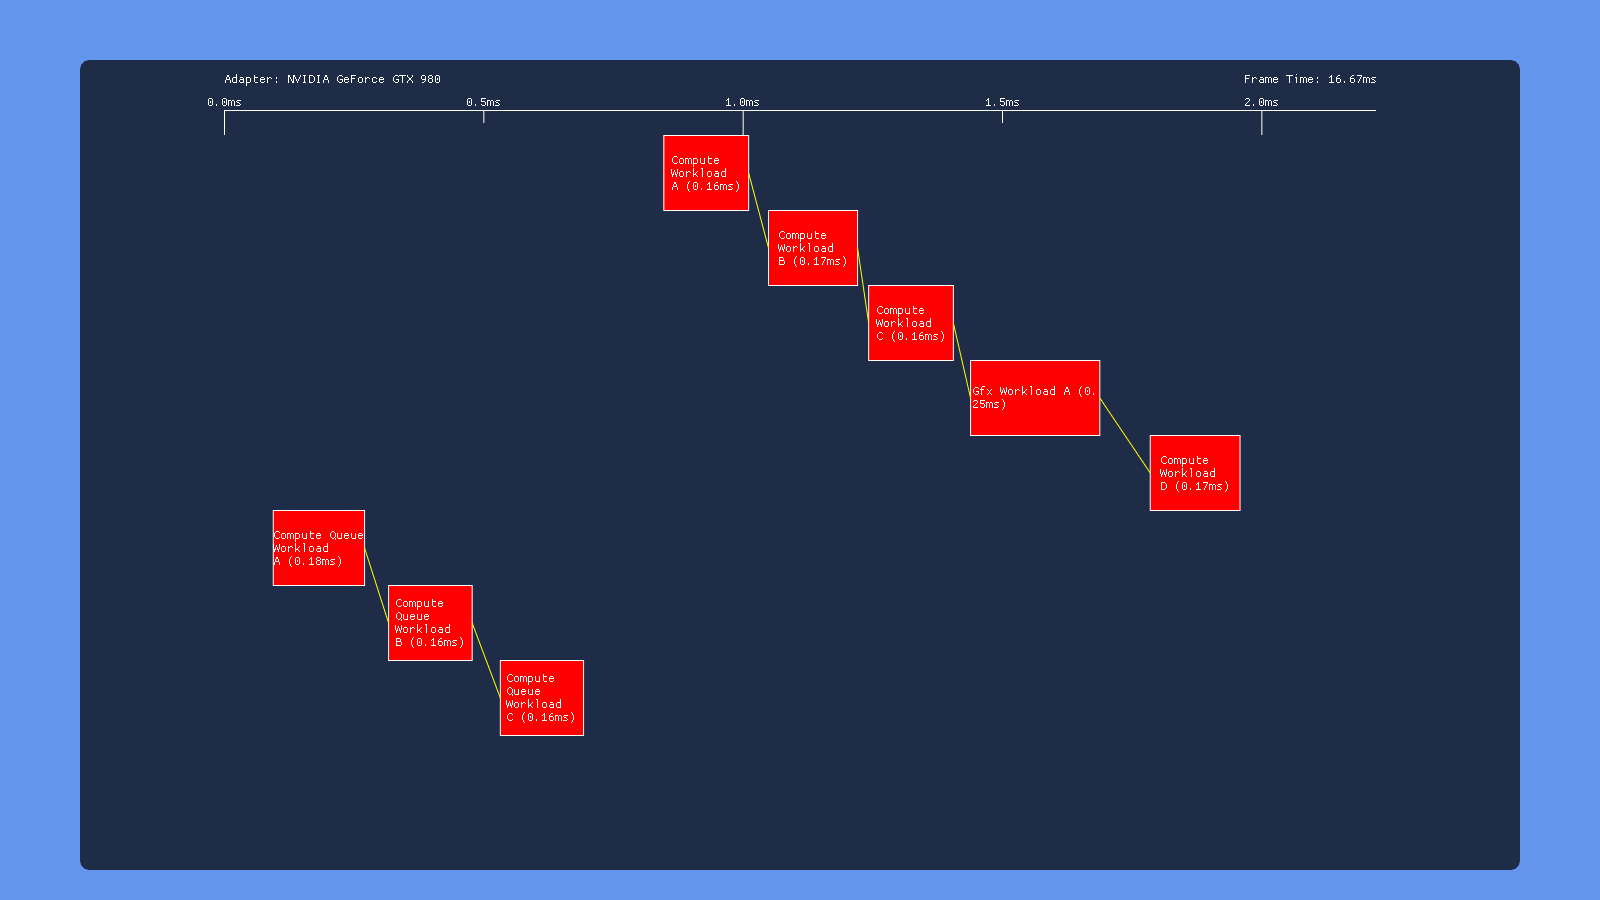
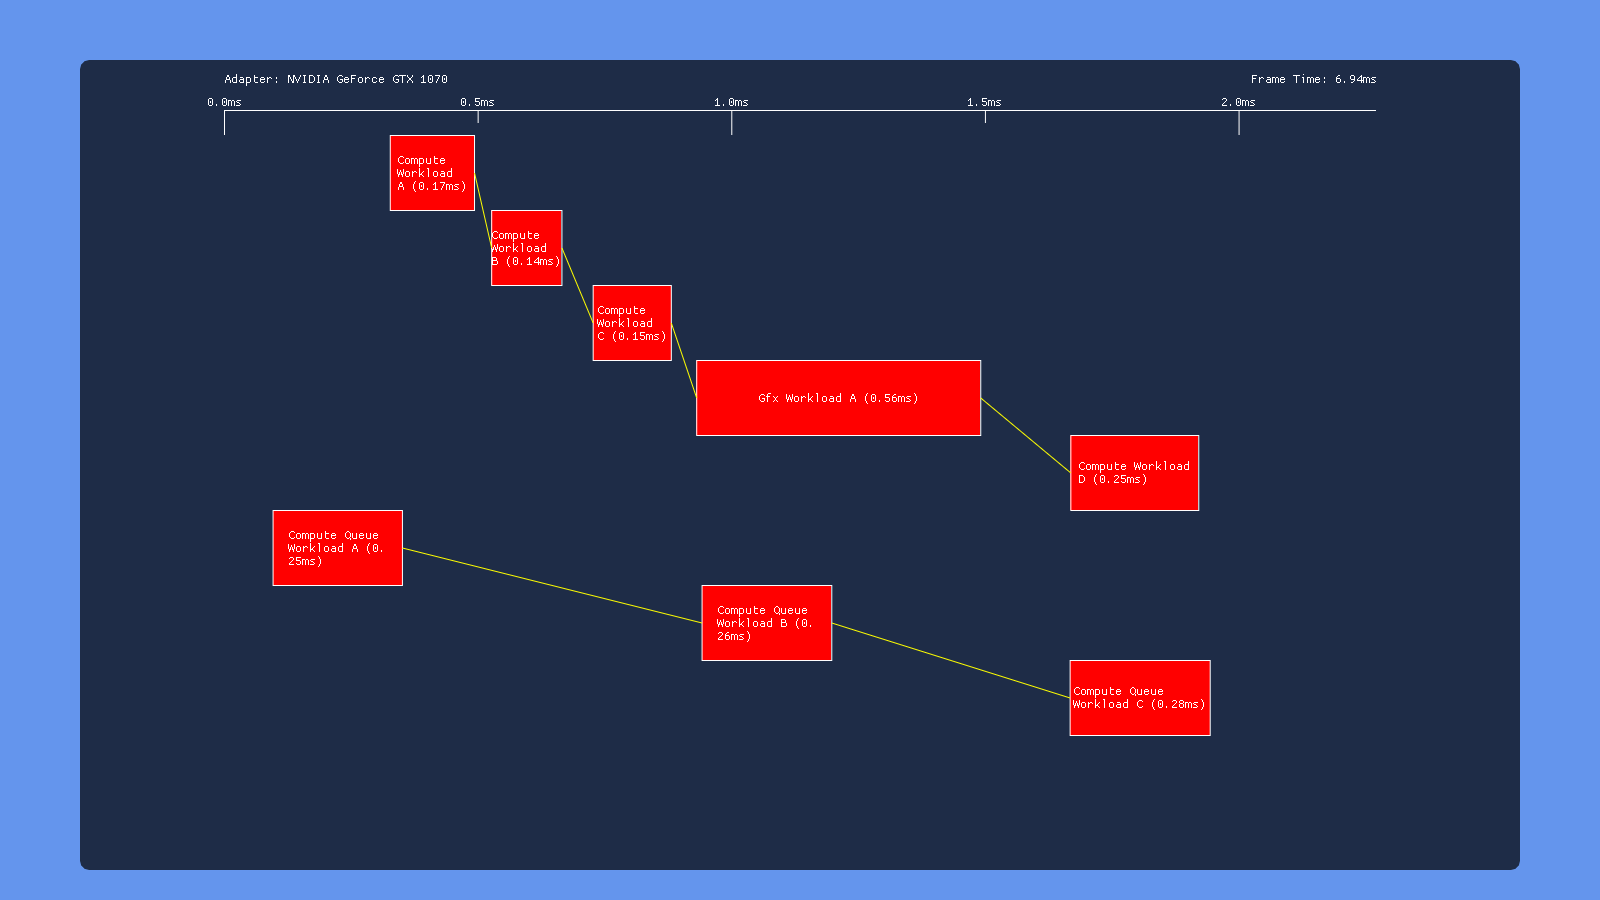
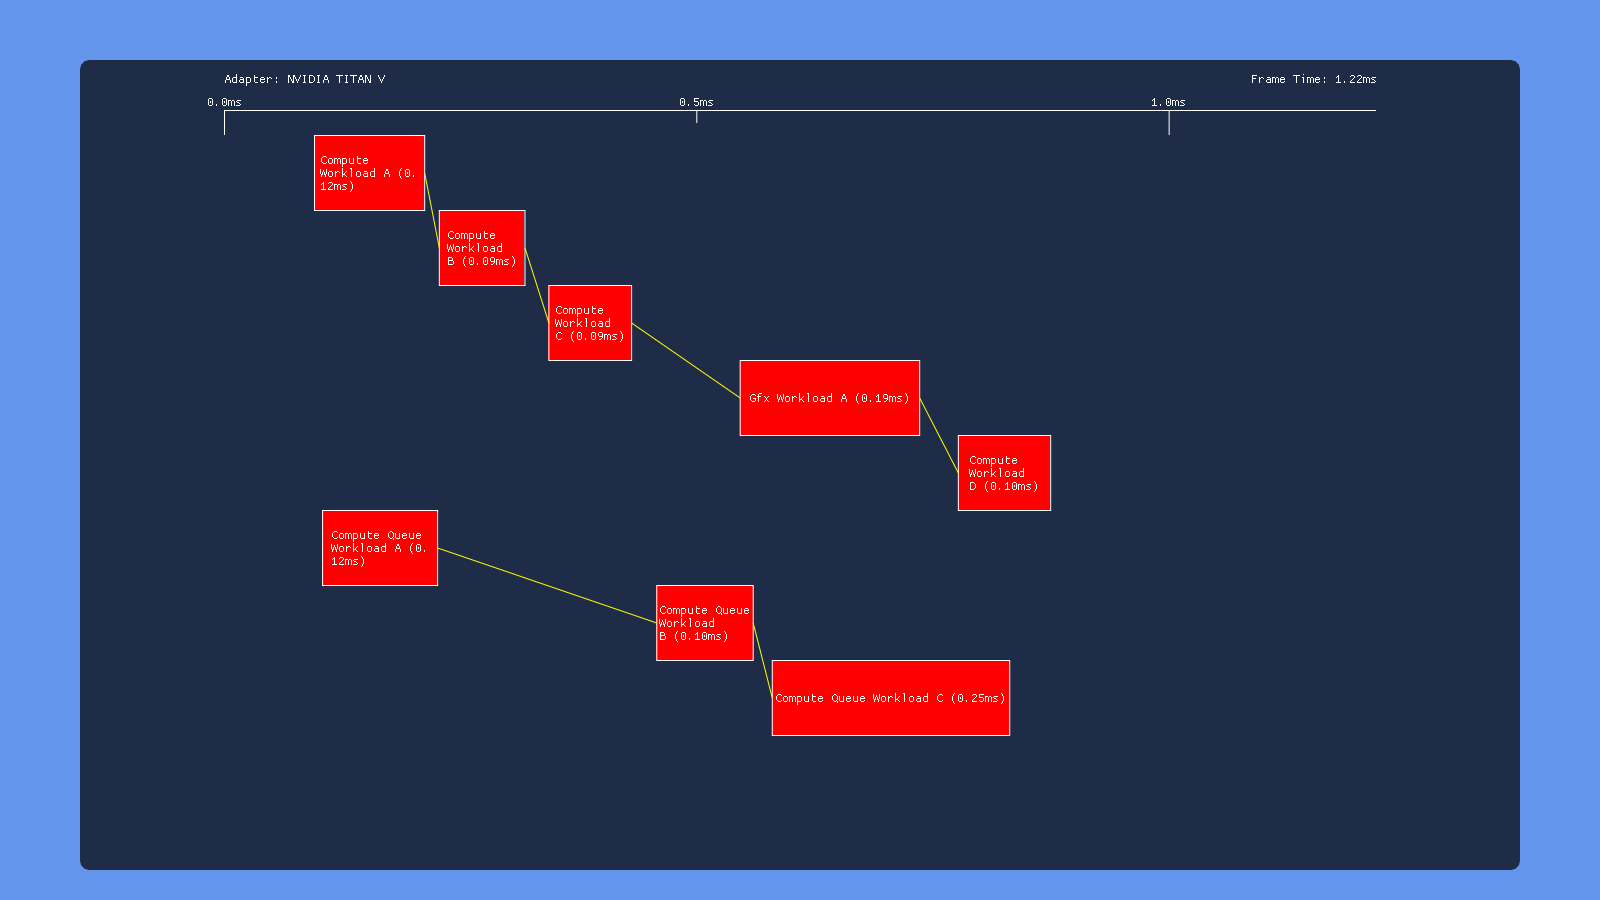
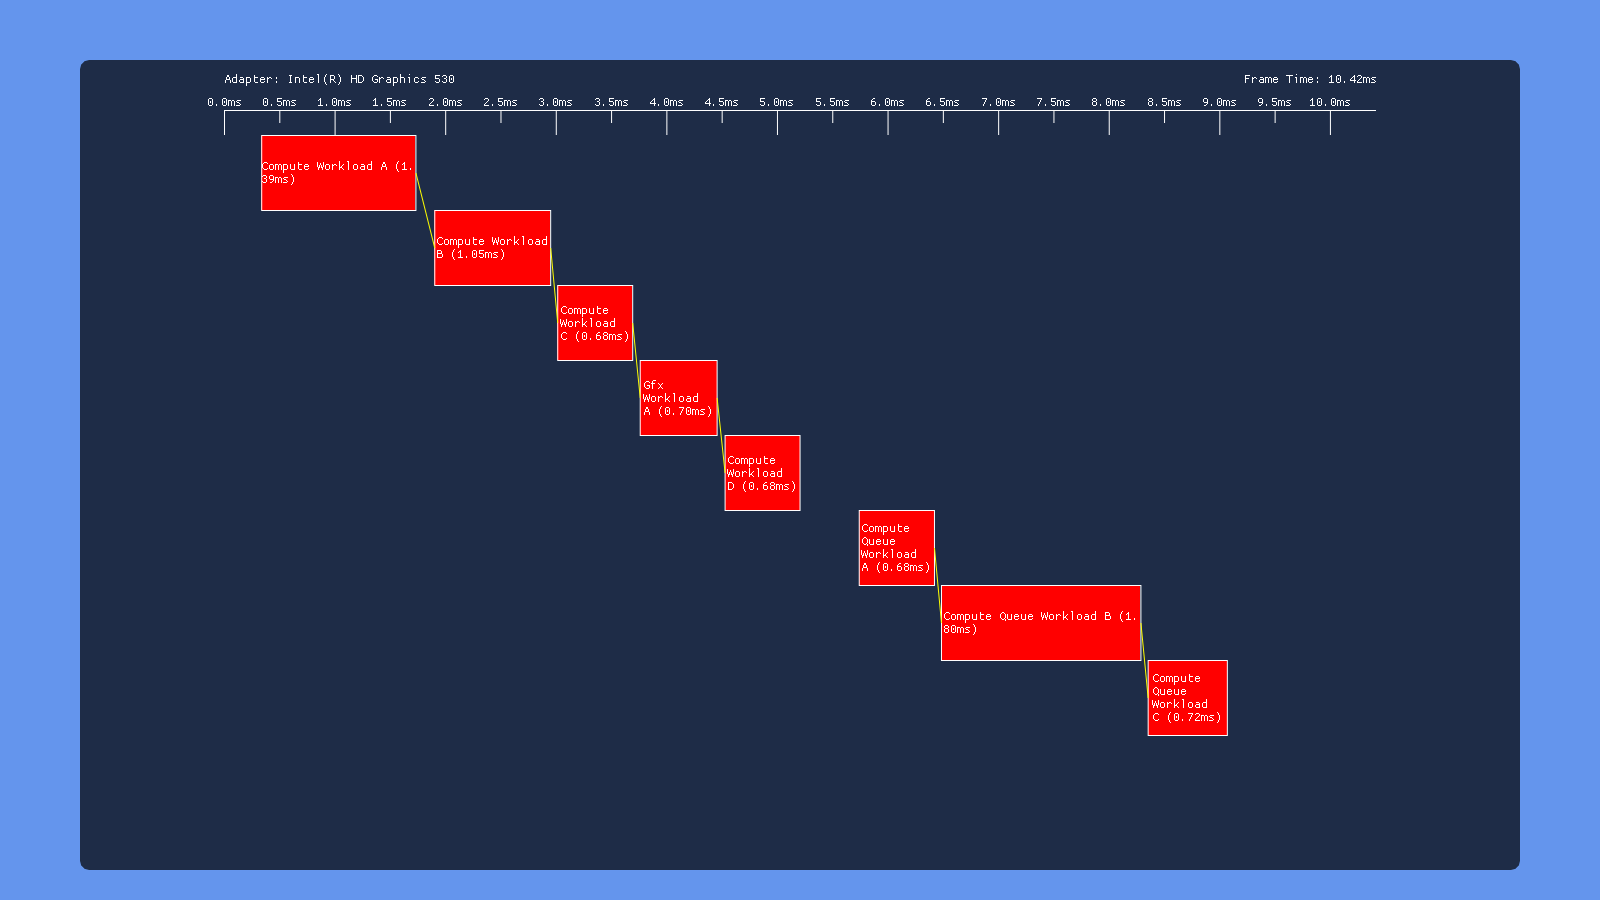
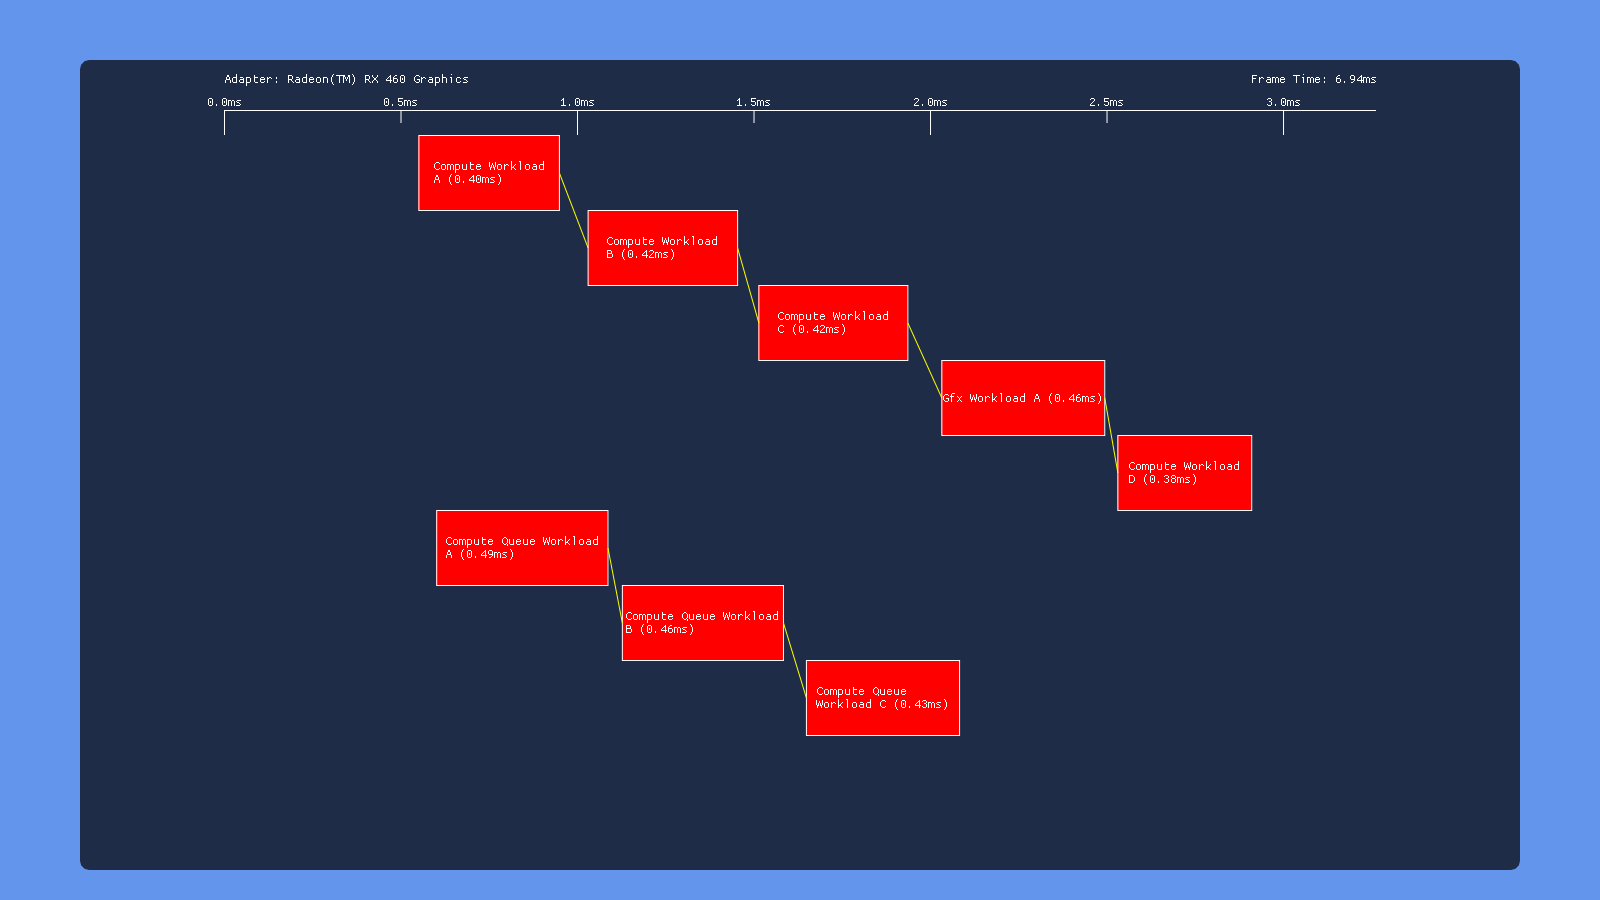
In all cases here we see what we would expect from having barriers between each workload: none of the individuals draws/dispatches overlap with other draws/dispatches on the same queue. However we get very different behavior in terms of how each GPU handles simultaneous submissions on both the COMPUTE and DIRECT queue. The 980 appears to serialize the work from the two queues, completely executing the COMPUTE submission before the DIRECT submission. Meanwhile the 1070 has some overlap, but with curiously large gaps between the dispatches on the COMPUTE queue. We also see that workloads with overlap end up taking longer, suggesting that overlapping dispatches or draws are competing for shared resources. The Titan V shows similar results to the 1070, albeit with some smaller gaps. Intel’s GPU also serializes the two submissions, which we would expect based on the lack of a COMPUTE queue being exposed in GPUView. Finally we have the RX 460, which seems to be capable of completely overlapping both submissions with no weird gaps. This is definitely what we expect based on AMD’s marketing material and developer advice regarding “async compute”.
One thing to note from these results is that the Nvidia and AMD GPU’s all have a noticeable gap following the graphics workload, which is performing a draw to a render target. This suggests that render target barrier results in more post-shader work than a dispatch, perhaps due to ROP and cache activity.
No Barriers


The 980 and 1070 GPU’s show similar behavior in this case: the first 3 dispatches on each queue overlap with each other very well, but the dispatches on the GRAPHICS queue refuse to overlap with the draw call in the graphics workload. This is unfortunate, because it suggests a cost for switching between compute and graphics operations. I tried many situations on both GPU’s, and ultimately I was never able to get a dispatch and a draw to overlap on the GRAPHICS queue. Multiple draws overlap each other just fine (as you would expect), but there seems to always be an implicit sync point when switching from compute to graphics (or vice versa). The Titan V manages better overlap for the 3 first 3 dispatches on the compute and graphics queues, but still has the same issue where the draw won’t overlap with any dispatches. Intel shows similar behavior in this test, with the dispatches overlapping some but no overlap between draws and dispatches. Meanwhile, AMD maintains its title as the “King of Overlapping” by showing no visible sync points whatsoever. Also of note is that the total execution time for AMD went from ~2.5ms to ~1.5ms by removing all of the barriers!
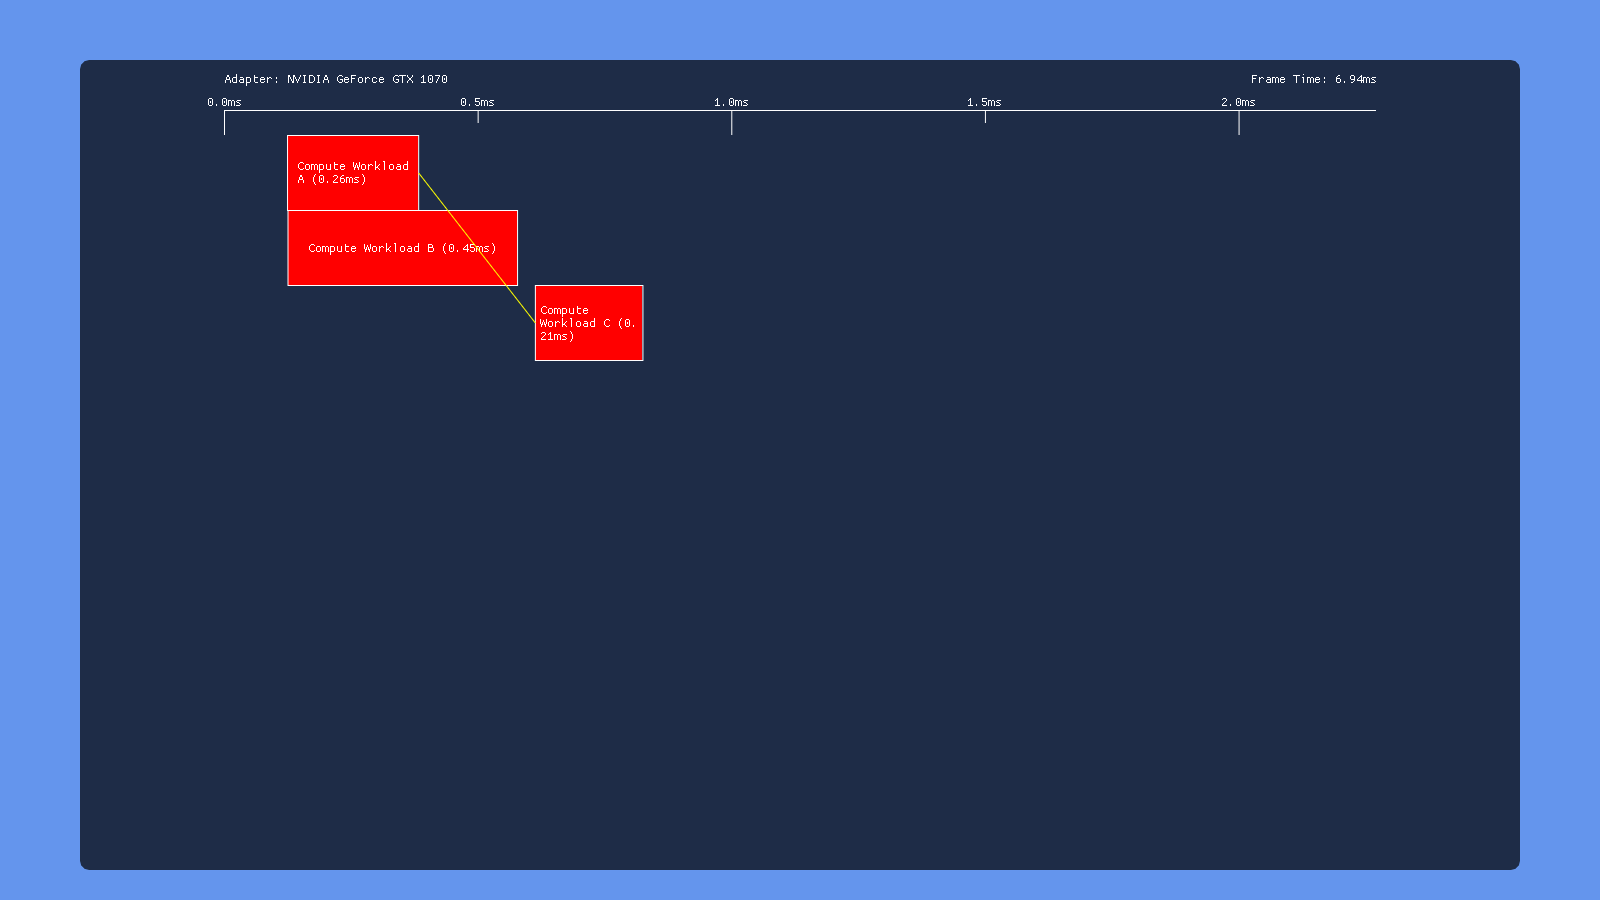
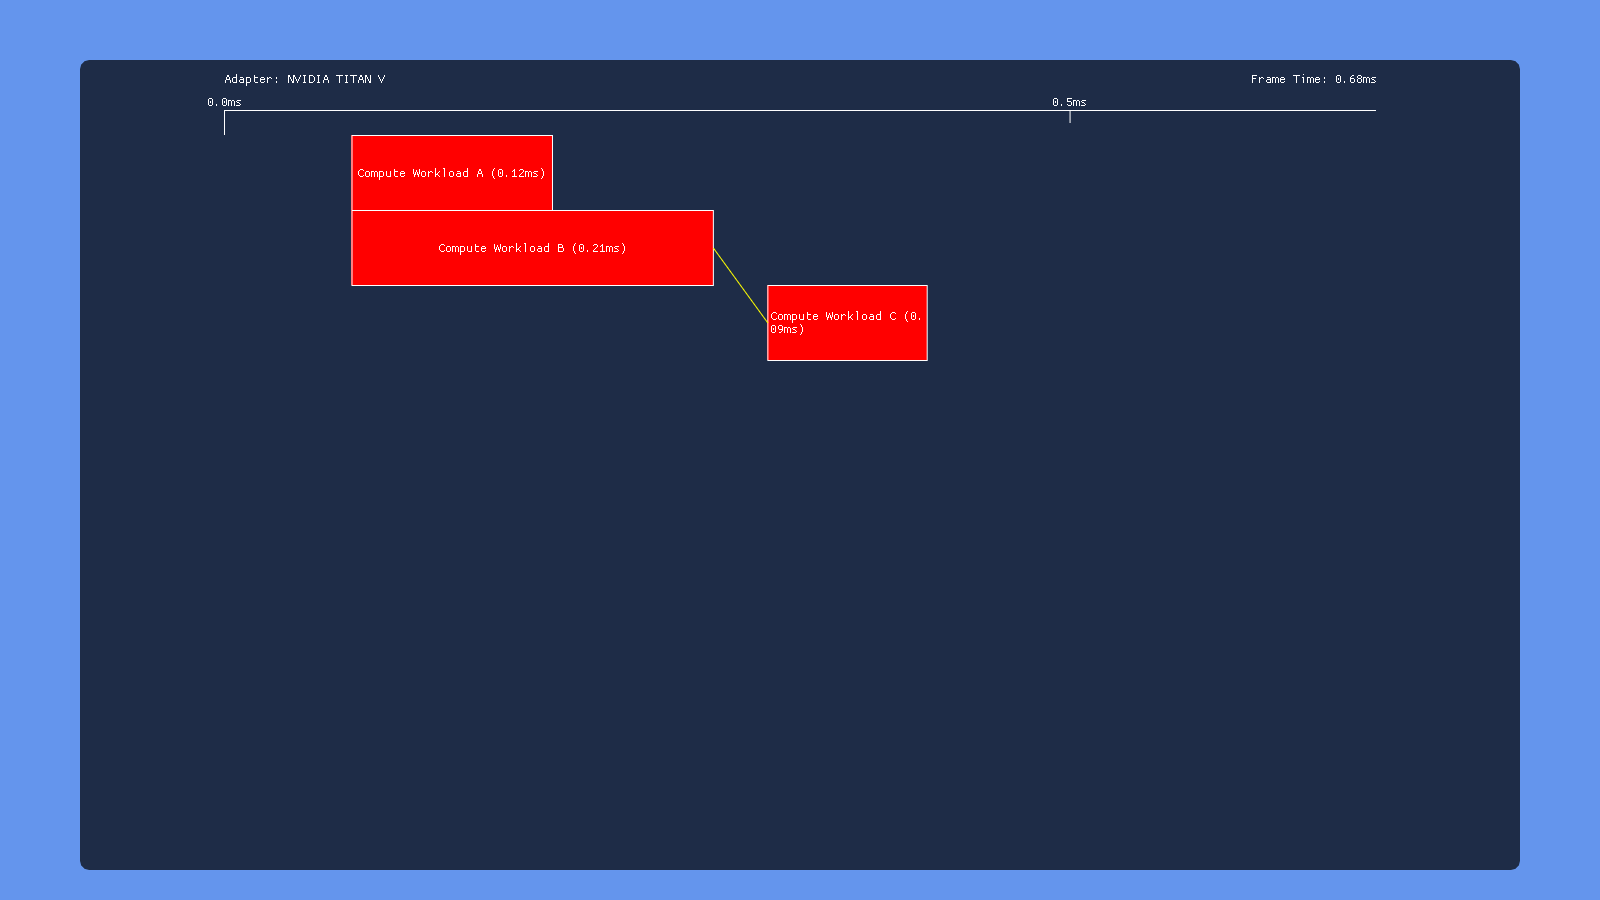
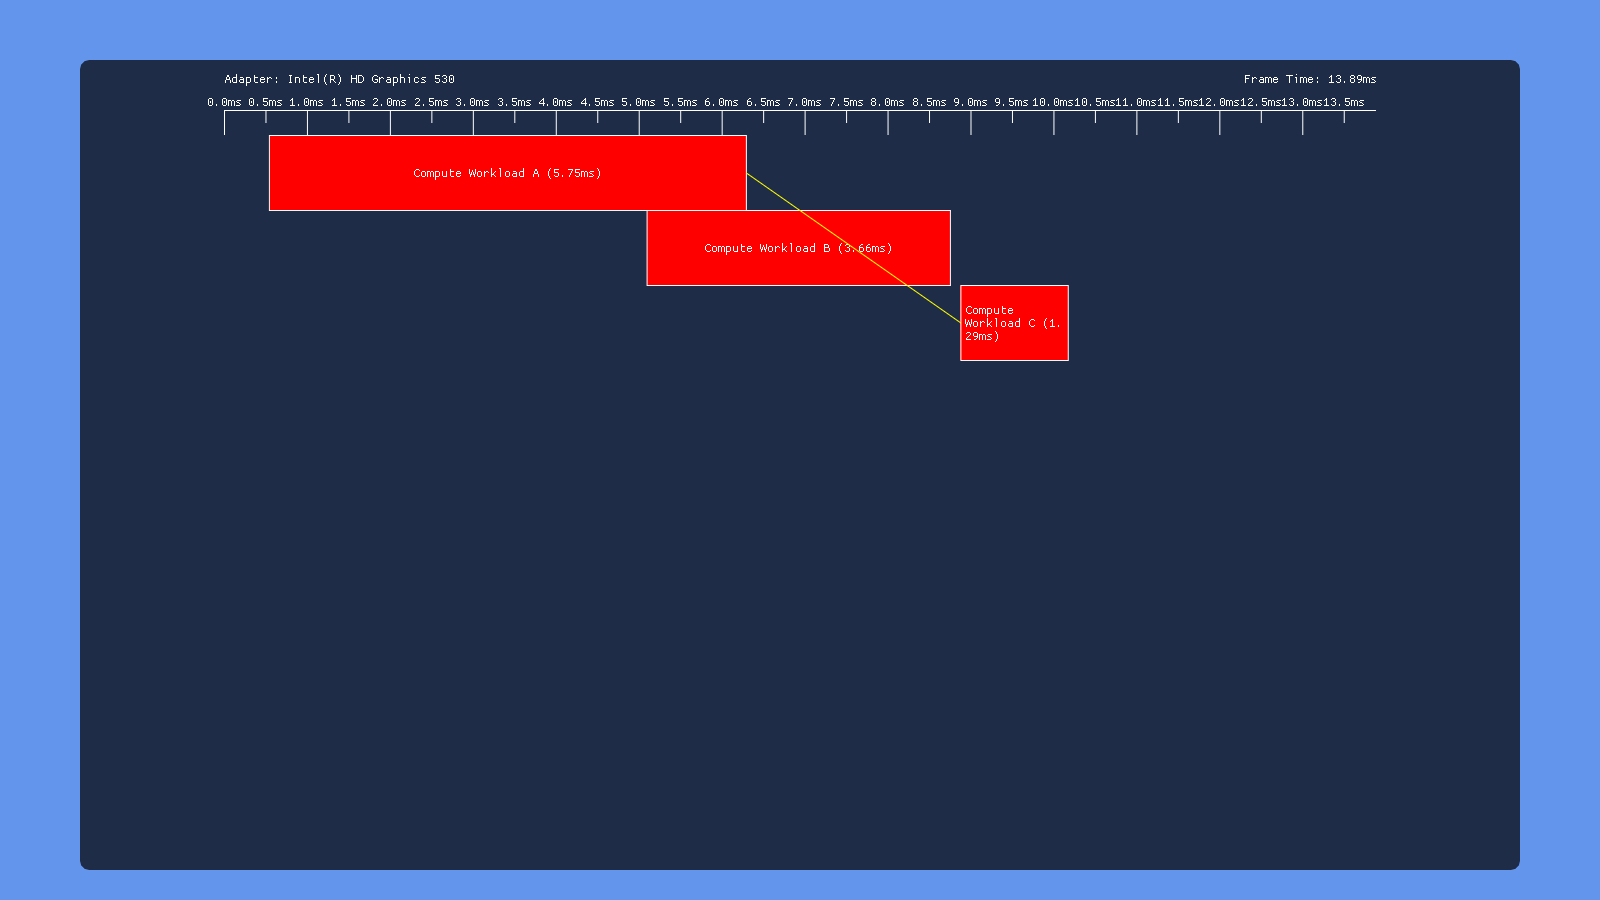
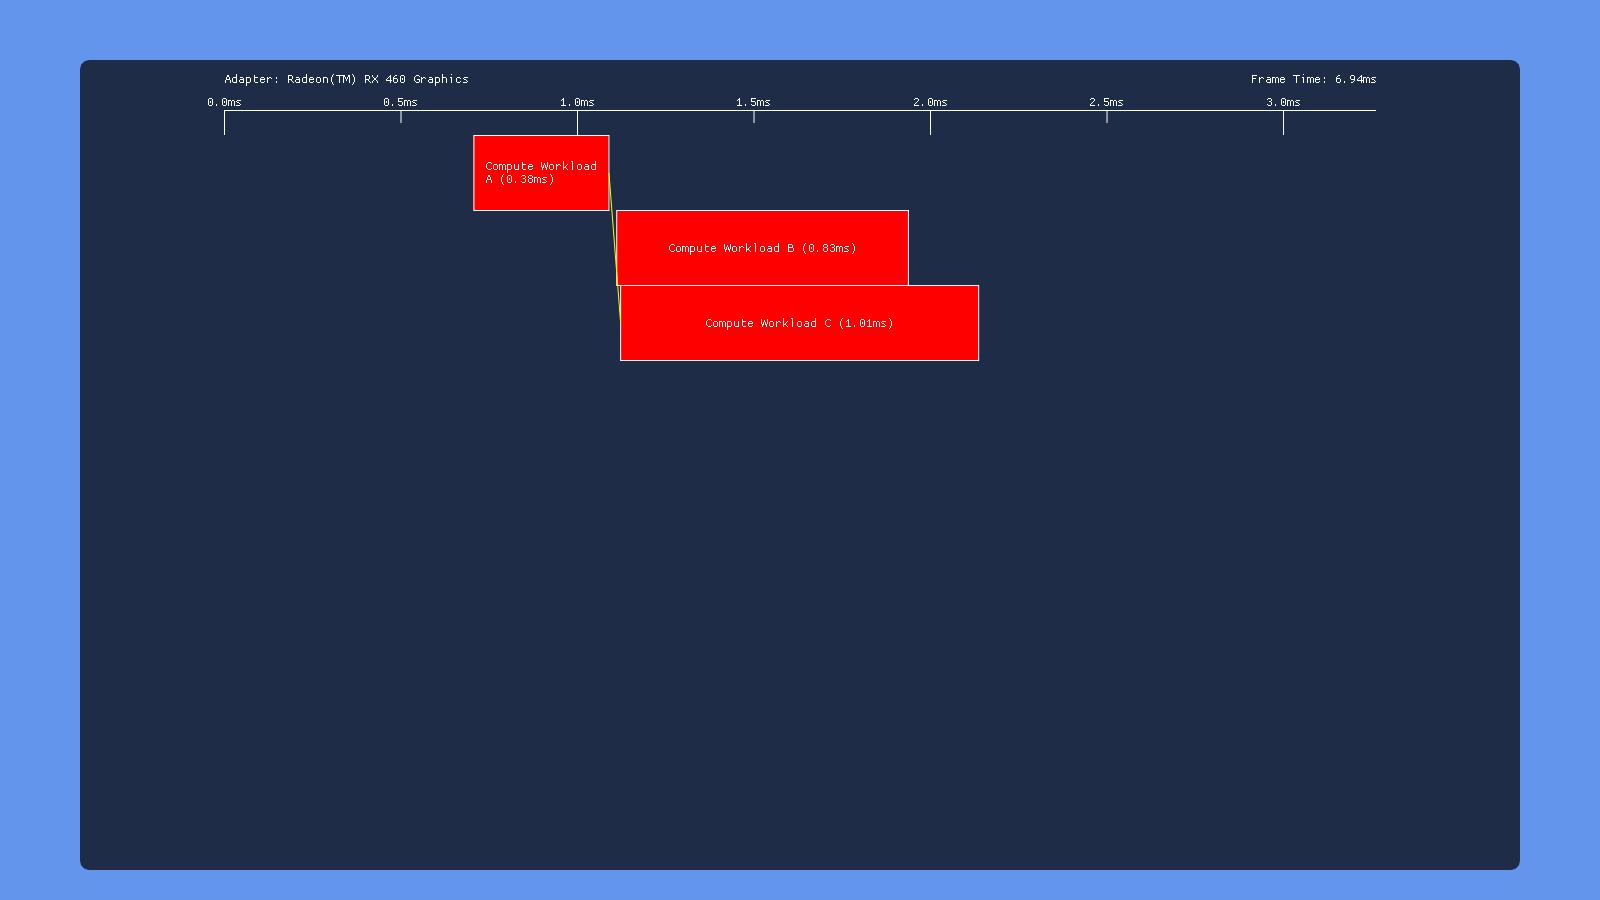
Three Dispatches
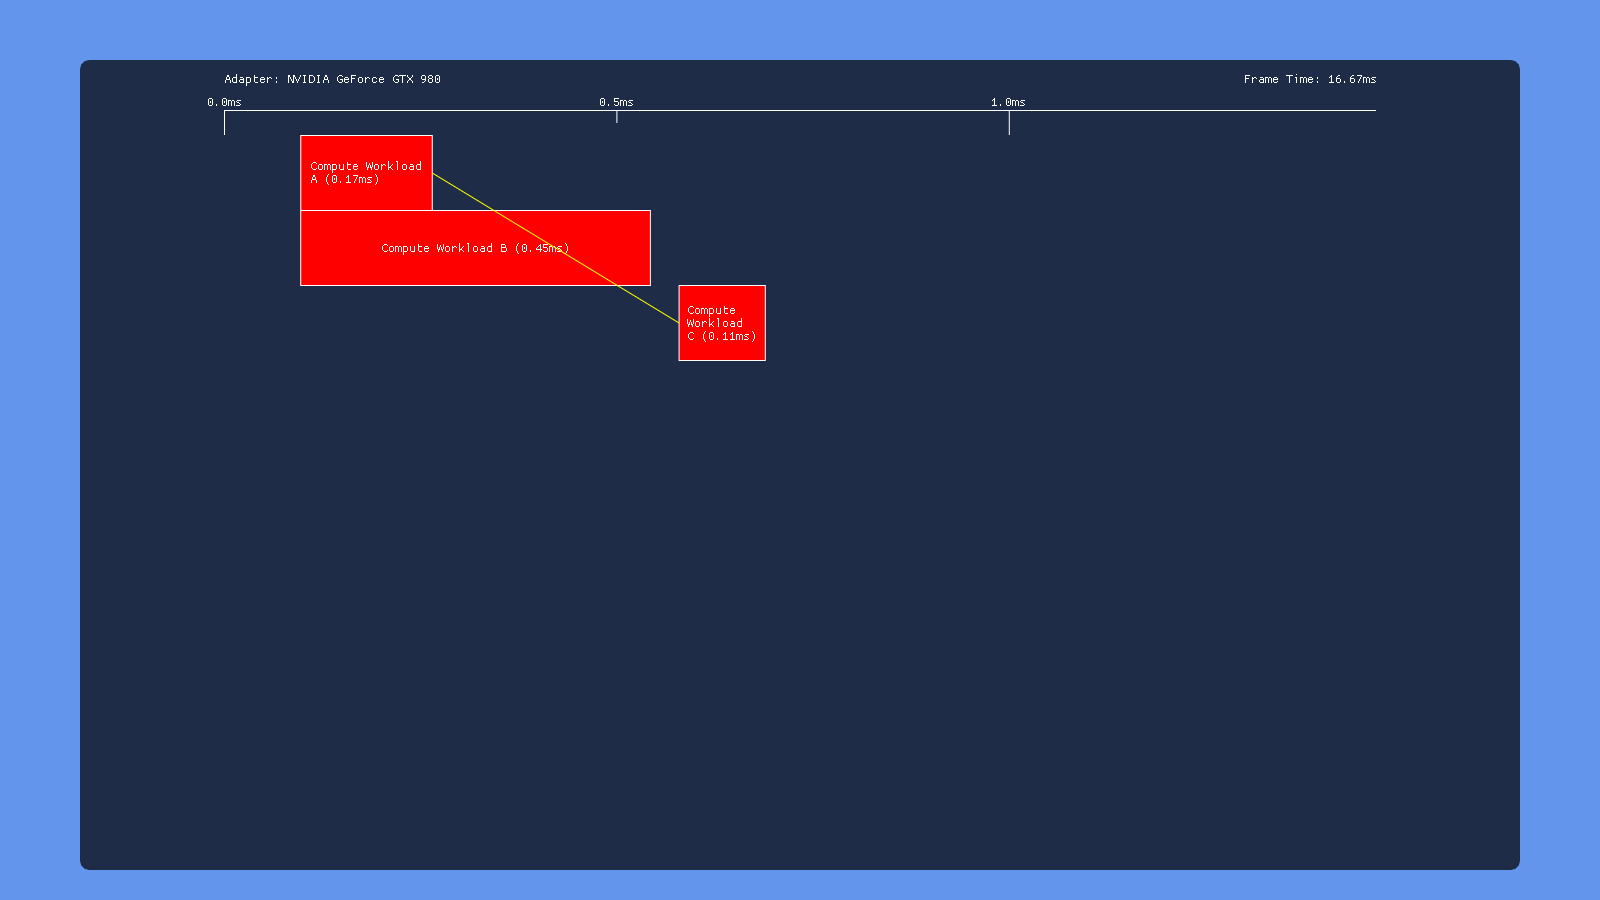

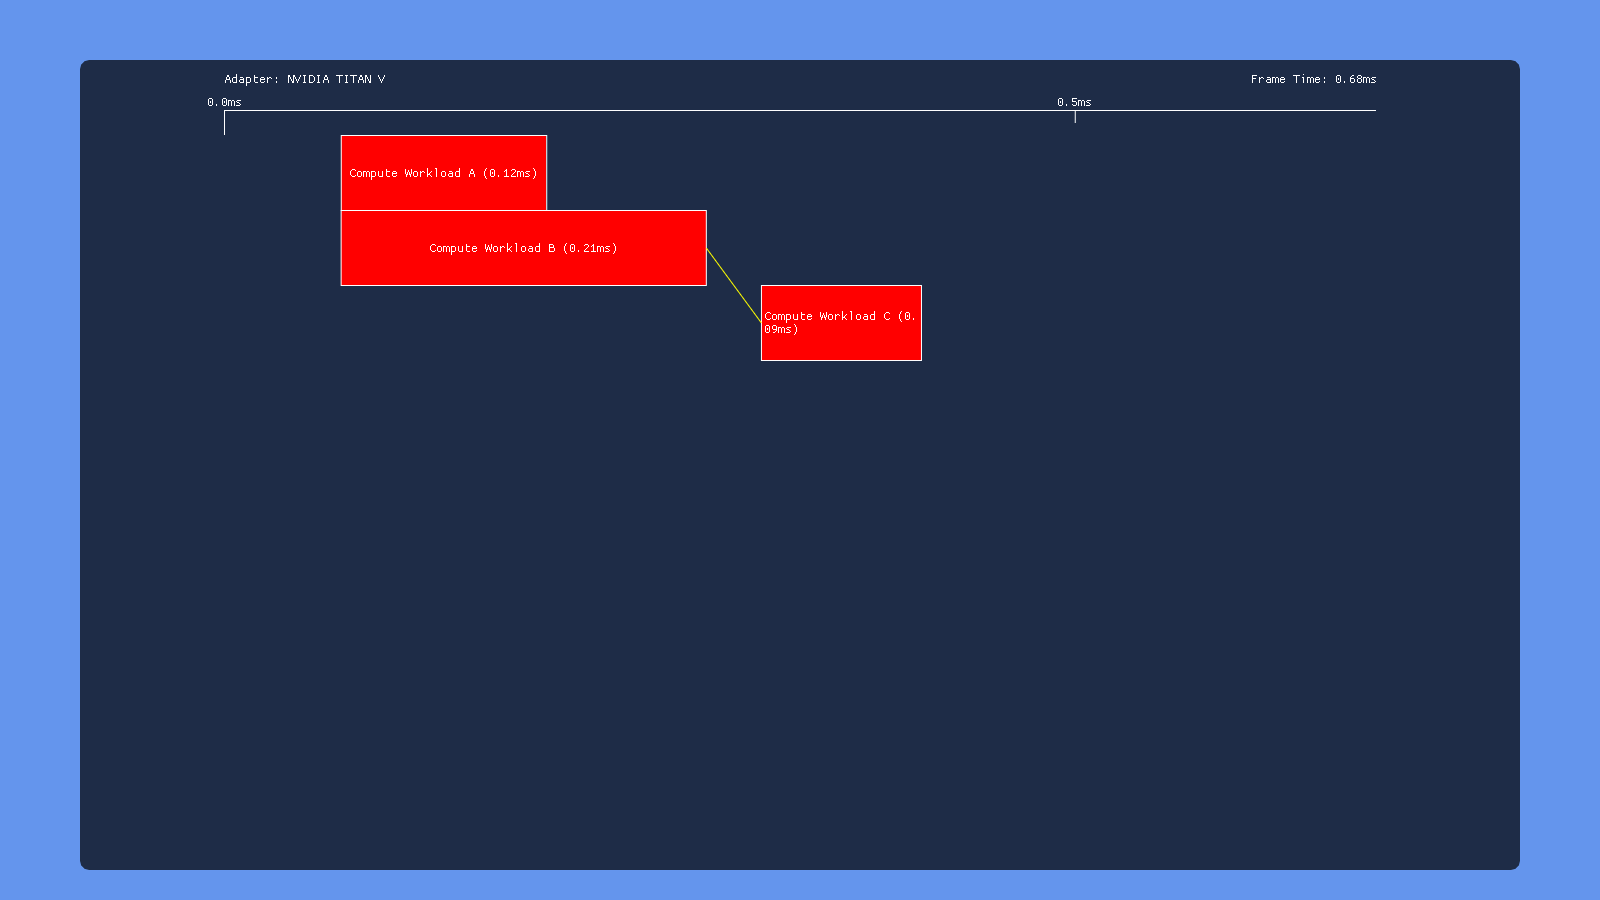
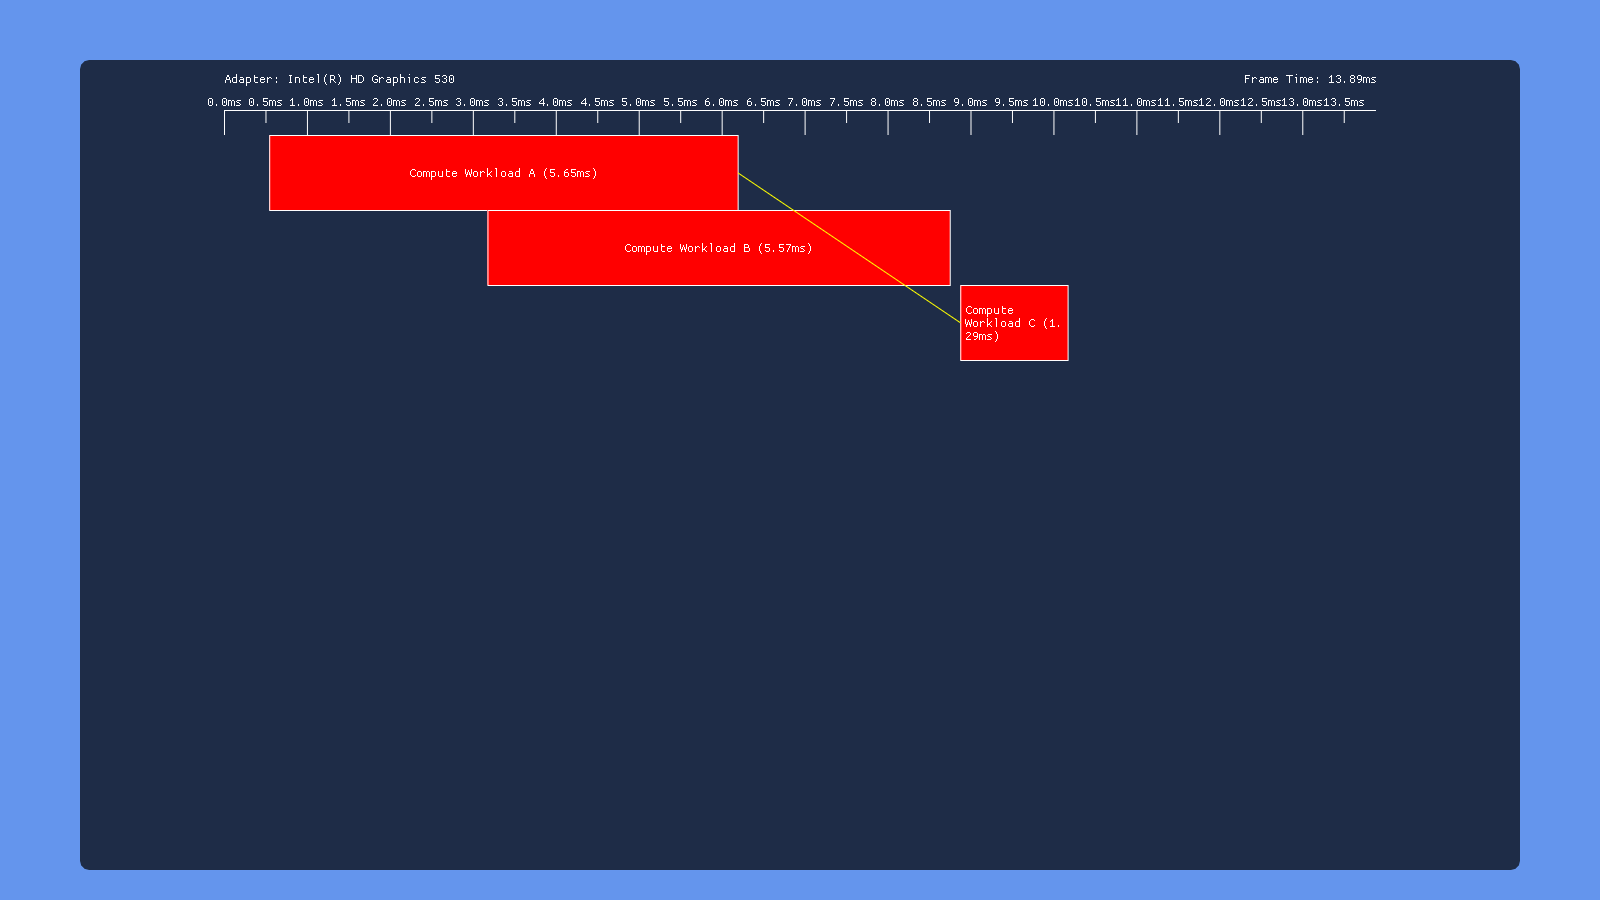
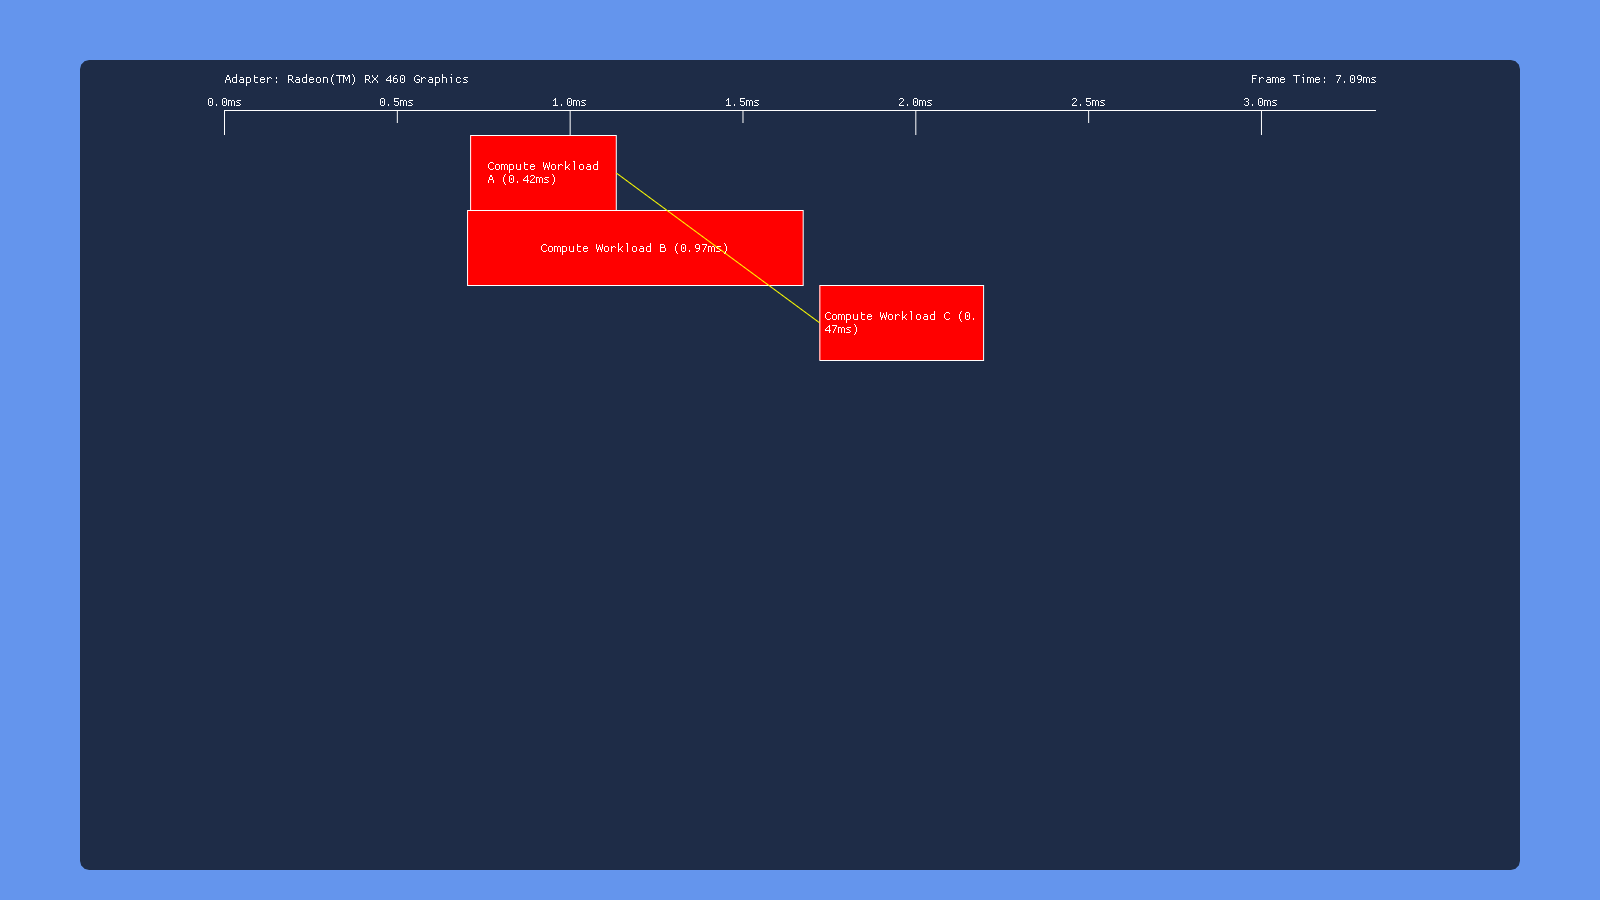
This time, the test results are very similar for all of our GPU’s: inserting a transition barrier on the result of dispatch A right before dispatch C causes C to wait for dispatch B to complete execution. This suggests that write->read barrier is implemented using a full pipeline flush on all 3 vendors.
Three Dispatches, Split Barrier

This time we have a split barrier surrounding the second dispatch. So we dispatch workload A, issue the start of a transition barrier, dispatch workload B, then end the transition barrier. Ideally this would allow A to overlap with B and B to overlap with C, but with no overlap between A and C. Unfortunately this doesn’t seem to happen on any of the hardware that I tested. On Nvidia and Intel the split barrier doesn’t seem to make any difference at all, giving the same behavior as issuing a non-split barrier following dispatch B. AMD is the only one that shows any change, but it looks like they just put a full sync point where the start of the transition barrier is issued (right after dispatch A). UPDATE 12/9/2018: as of driver version 18.12.1.1, my 460 now shows the exact same behavior for split barriers as it does for a standard transition barrier. So it looks like now the driver syncs on the “end” of the split barrier instead of at the “begin”.
High-Priority Compute

Using the PRIORITY_HIGH flag on the compute queue doesn’t seem to make much of a difference on AMD and Nvidia. On Intel however it causes the COMPUTE submission to get executed before the DIRECT submissions, indicating that it affects the order in which submissions get serialized. This makes sense given what we know about this flag, which only influences the OS scheduler in cases where the OS is serializing submissions from multiple software queues so that they can be consumed by a single hardware queue.
I put the test app on GitHub, so feel free to play around it or fork for your own experiments!
UPDATE 12/15/2018: I just ran the overlap tests on my Nvidia RTX 2080, and the results are very similar to what I was getting from the GTX 1070 and Titan V.
Preemption Analysis
To wrap things up, I also wanted to include a quick analysis of preemption support for the GPU’s I have available to me. Analyzing preemption is naturally tricky: it mostly comes into play when multiple applications are using the GPU simultaneously, and the exact behavior can vary depending on what those applications are doing with the GPU, and also how “important” they are in the eyes of the OS. These issues lead me to set up a set of very simple experiments where I could observe the preemption behavior using both tools as well as my own eyes. The basic setup worked like this:
-
First, I would start up a modified version of DX12 Deferred Texturing demo, and disable VSYNC so that it would run un-throttled. This would saturate the GPU with a constant load, with no gaps between submissions. This gives us a chance to observe whether DWM (the desktop composition engine in Windows) can preempt in order to re-composite and present to the display.
-
Next, I would put on my Oculus Rift headset, which would cause the “Oculus Home” app to start submitting 3D rendering commands to the GPU (it runs on Unreal Engine). These submissions would compete with the deferred texturing demo for GPU time, showing how the OS and GPU handle scheduling in the case of two applications performing rendering commands.
-
Putting on the headset means that the Oculus compositor service starts up, which is what actually presents frames to the headset. This service can make high-priority submissions to the GPU, which is intended to allow the compositor to continue presenting frames at 90 Hz even if the source VR application is failing to do so (this is very important for maintaining smooth updates from head movements). Thus we can also observe how the GPU handles preemption for a very specialized, high-priority scenario.
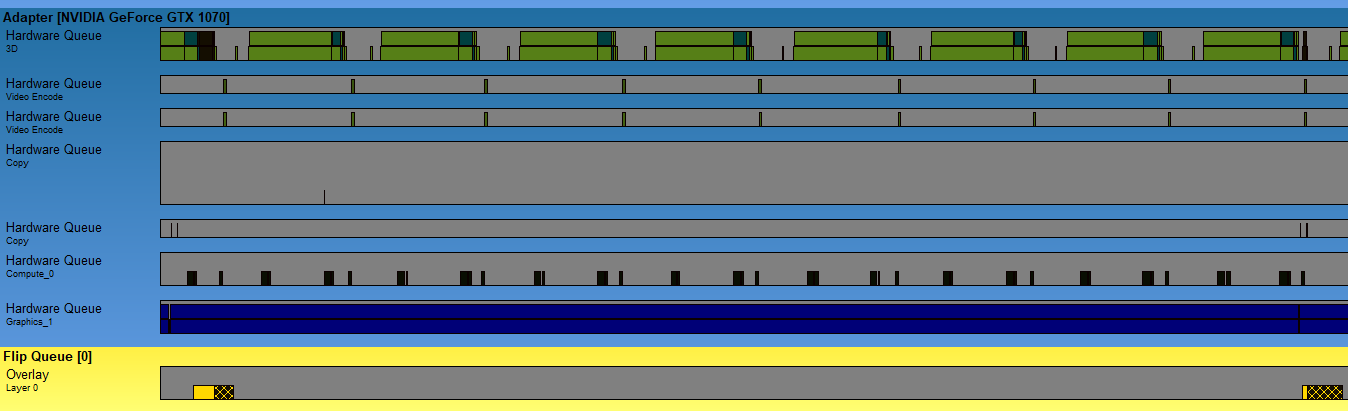
First, we’re going to look at how things worked on my primary GPU at the time I ran these experiments, which was an Nvidia GTX 1070. Here’s what the GPUView capture looked like when running Oculus Home at the same time as my unmodified, un-throttled deferred texturing app:
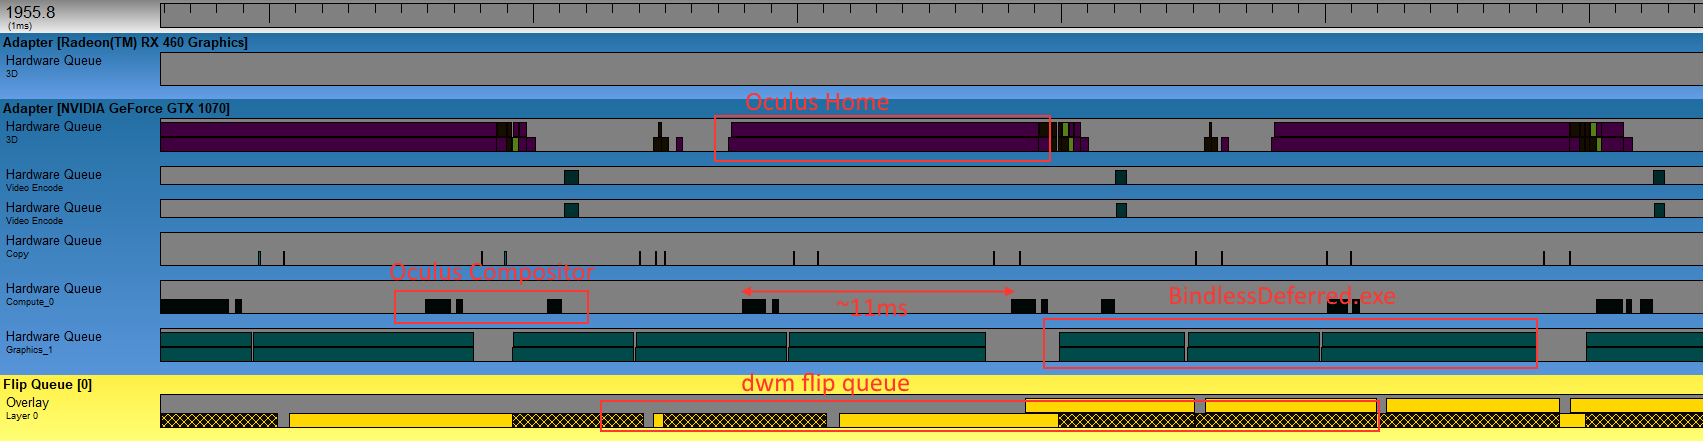
This is what I call the “baseline” scenario, where I haven’t done anything to really screw with preemption. We can see here that the submissions from Oculus Home and BindlessDeferred.exe actually end up on separate hardware queues, with one called “3D” and one called “Graphics_1”. The deferred texturing app is cruising along, generally taking anywhere from 5 to 10 milliseconds to complete a frame. Meanwhile Oculus Home is is taking about 12 milliseconds to complete, which is causing the Oculus service to drop into what they call Asynchronous Spacewarp (or ASW for short). When ASW kicks in the VR app is throttled to 45 Hz, but the Oculus compositor continues to present frames at 90Hz using interpolation techniques to generate the “in between” frames. In other words my GPU doesn’t have enough resources to keep both apps running at 90Hz, but the Oculus compositor is successfully using preemption to ensure that the headset is staying responsive to user input. In this particular case it looks like the Oculus service is submitting its commands to a compute queue, labeled “Compute_0”.
So how about DWM? If we expand that image a bit, we can see the CPU side of DWM’s submissions down below:

So we can see DWM submitting a command buffer, which ends up sitting enqueued for quite some time before it ends up actually executing on the 3D hardware queue. It looks like DWM commands end up getting submitting on a normal graphics/DIRECT queue as opposed to a compute queue, and it also looks like that process is getting bullied out of using the GPU as often as it would like. I was running this on a 144 Hz monitor, and here we see DWM flipping at a rate of around 72 Hz.
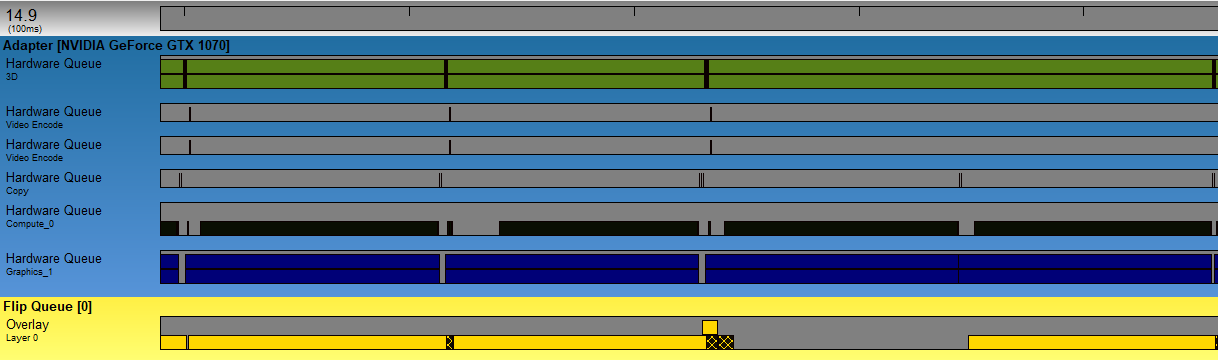
For my next scenario I wanted to really turn up the heat to stress the system and see how everything responded. To do this, I modified the deferred texturing demo to over-submit its draw calls by a constant factor. This caused the GPU frame time to increase to about 100 milliseconds, making preemption crucial for maintaining anything resembling responsiveness. Here’s the GPUView capture:
Despite our best efforts at hogging the GPU, preemption and multiple queues seem to be working they way you’d expect in this scenario. The Oculus Home application is still failing to run at 90Hz due to sharing the GPU, but the Oculus compositor is ticking regularly every 11ms or so. This is all good news, but let’s see what happens if we try a different approach:
This time, I modified BindlessDeferred to launch way more threads than it actually needed to when executing the deferred shading dispatch. This caused the frame time to balloon to about 100ms, and from the capture we can see that it took the Oculus Home app down with it. Even worse, the Oculus compositor app also seems to be unable to get the GPU to complete its small amount of work. The compositor submissions seem to be scheduled on the GPU’s compute queue, however it sits there for nearly 100ms before completing. This suggests that our “Big Dispatch” is hogging the entire GPU, and the other submissions are unable to preempt this dispatch while its threads are executing. We see similar results in my final test scenario, which uses a normal-sized dispatch but artificially increases the execution time of a single thread by looping in the shader program:
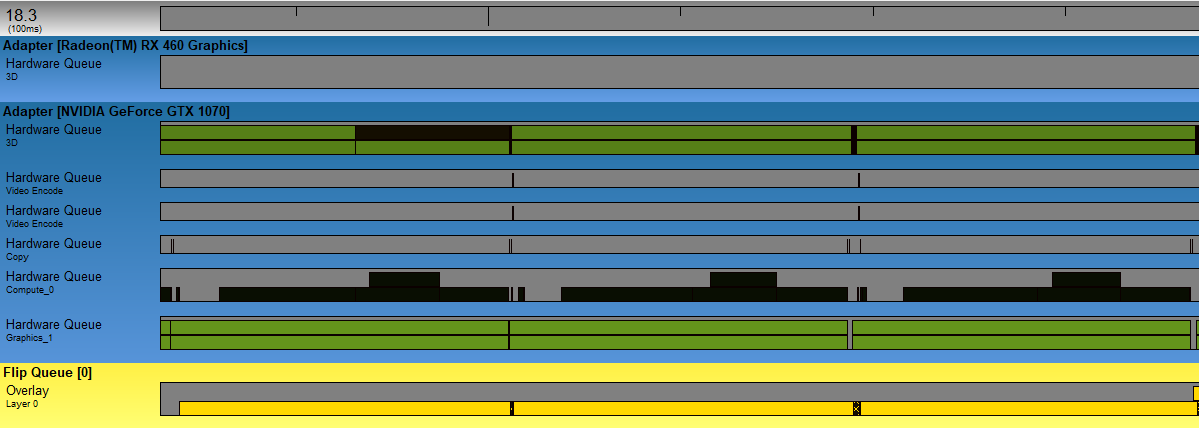
Once again everyone suffers in this scenario, and I can tell you first-hand that you do not want to put on a VR headset under these kinds of conditions.
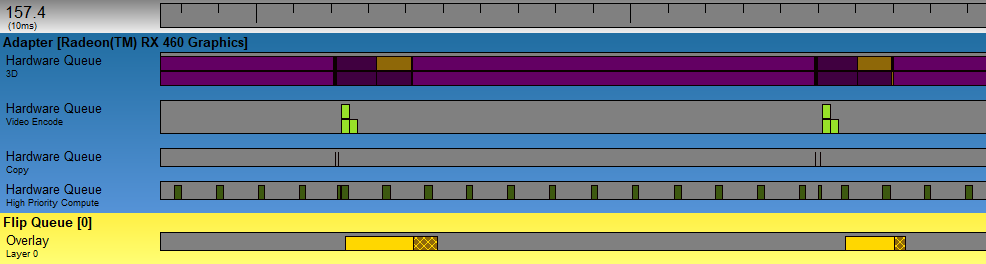
To finish things off, let’s take a look at how the same scenarios played out on my AMD RX 460. Here’s the baseline capture:
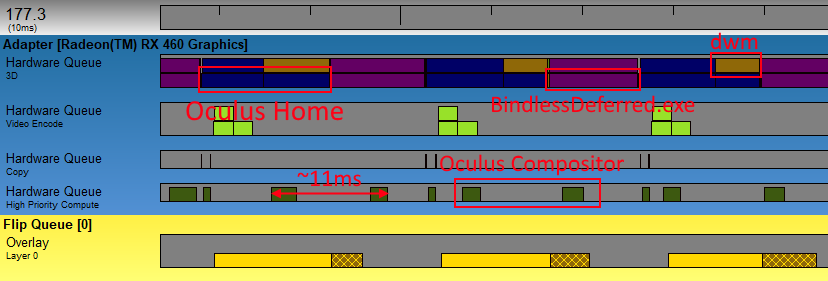
The AMD captures are a little harder to parse, since the D3D11 and D3D12 submissions end up on the same hardware queue (named “3D” here). This also suggests that this hardware may be worse at allowing Oculus Home and BindlessDeferred to share the GPU, since they’re pretty much taking turns on the graphics queue instead of executing concurrently. However, we do see something rather interesting here if we look at the submissions from the Oculus compositor. The compositor work is executing on a hardware queue named “High Priority Compute”, which suggests that it’s perhaps making use of the “Quick Response Queue” functionality mentioned in AMD’s marketing material. Let’s see how things shake out in our “Many Draws” scenario:
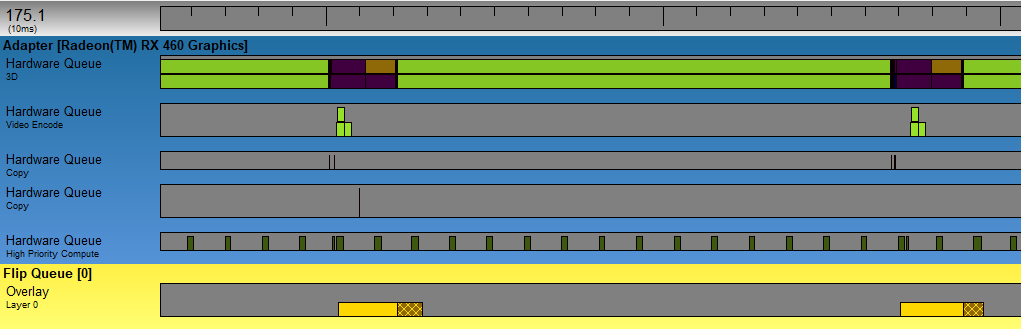
As we feared, the AMD GPU holds up worse (compared to the Nvidia GPU) when it comes to letting the Oculus Home app (darker purple) share the GPU. BindlessDeferred (lighter purple) is taking over 100ms per-frame to complete, and it appears that Home needs to wait for the (single) command buffer submission to completely finish before it can start executing. The Oculus compositor, on the other hand, is executing very regularly. The compute submission comes in every 11ms, and consistently takes about 1.8ms to finish. In other words: Home is nowhere near making 90Hz, but the compositor is making sure that a new time-warped frame comes in every 11.1ms. This allowed things to remain comfortable when I put on the headset…provided I didn’t rotate my head to the sides very quickly. Next, let’s look at the “Big Dispatch” scenario:
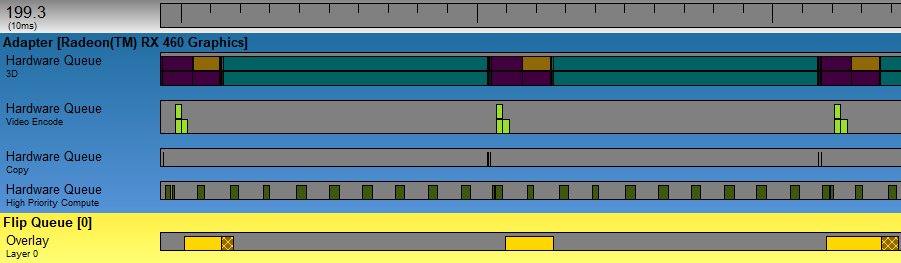
As expected, the frame rate of Oculus Home (purple) remains very bad in this scenario. The submission from BindlessDeferred (light green) continues to hog the single graphics queue, forcing Home to wait 100ms or so before it gets a turn. On the bright side, AMD’s High Priority Compute queue continues to deliver the goods! Despite the massive number of compute threads swarming the GPU from the big dispatch, the compositor’s submission continues to run at a steady rate of 90 Hz. Very impressive! But will it hold up in the final “Slow Shader” scenario? Let’s find out!
Indeed, AMD’s high-priority compute keeps working even in the case where very slow shader programs are running on the GPU. The only noticeable difference is that the compositor submission now takes about 2.4ms to complete, but other than that things look good. Ultimately it looks like Nvidia and AMD hardware do a better job in different scenarios, so I don’t think we could say that one is inherently “better” than the other. In the future I’m sure we’ll see new innovations from both IHV’s in this area, so I wouldn’t get too hung up on these specific results.
End of Pipe
That’s it for the series! Thank you to anyone who stuck around through the whole thing, which has now spanned 9 months! I learned quite a bit myself while doing research for these articles, so I’m glad that I kept it going. But I think for my next post I’m going to do a shorter write up that doesn’t take me two years to finish. :)
Comments:
Really good article, as always! I think there’s a small typo in “but no overlap between A and B. “, should be C instead of B?
#### [MJP](http://mynameismjp.wordpress.com/ "mpettineo@gmail.com") -
Indeed, that was a typo! Thank you for pointing that out.
#### [Andy Robbins](http:// "raicuandi@gmail.com") -
Excellent series!
#### []( "") -
very helpful to me, thank you!
#### [SONG]( "yqsong.hong@gmail.com") -
Great articles. I’ve learned a lot about how GPU works in parallel.
#### [Breaking Down Barriers – Part 1: What’s a Barrier? – The Danger Zone](https://mynameismjp.wordpress.com/2018/03/06/breaking-down-barriers-part-1-whats-a-barrier/ "") -
[…] Part 1 – What’s a Barrier? Part 2 – Synchronizing GPU Threads Part 3 – Multiple Command Processors Part 4 – GPU Preemption Part 5 – Back To The Real World Part 6 – Experimenting With Overlap and Preemption […]
#### [Breaking Down Barriers – Part 2: Synchronizing GPU Threads – The Danger Zone](https://mynameismjp.wordpress.com/2018/04/01/breaking-down-barriers-part-2-synchronizing-gpu-threads/ "") -
[…] Part 1 – What’s a Barrier? Part 2 – Synchronizing GPU Threads Part 3 – Multiple Command Processors Part 4 – GPU Preemption Part 5 – Back To The Real World Part 6 – Experimenting With Overlap and Preemption […]
#### [Bryan]( "Bryan.Corell@disruptivegames.com") -
Great series! Very in depth and would love to see more :)