Breaking Down Barriers – Part 5: Back To The Real World
This is Part 5 of a series about GPU synchronization and preemption. You can find the other articles here:
Part 1 - What’s a Barrier?
Part 2 - Synchronizing GPU Threads
Part 3 - Multiple Command Processors
Part 4 - GPU Preemption
Part 5 - Back To The Real World
Part 6 - Experimenting With Overlap and Preemption
Welcome to part 5 of the series! If you’ve read all of the articles so far, thanks for hanging in there! In the last article, we spent a good deal of time talking about how GPU preemption might work for an imaginary GPU. We also talked about how having multiple command processors capable of kicking off GPU threads could potentially be helpful for reducing preemption latency, which in turn can improve the overall responsiveness of a GPU that needs to serve multiple applications. For this article, I want to get back to discussing real-world GPU’s, and how they deal with preemption in the context of an actual OS and driver infrastructure. I’m mostly going to restrict myself to discussing Microsoft Windows and its associated Windows Display Driver Model (WDDM) and native 3D graphics API’s (D3D11 and D3D12), since these are what I know best and have the most experience in. So I’m afraid you’ll have to look elsewhere if you need comprehensive information about Linux, MacOS, OpenGL, or Metal. I will talk just a bit about Vulkan in a few places, but I’m pretty far from an expert on that topic. I’m also going to only talk about desktop GPU’s, since these are what I deal with almost exclusively in my line of work.
The first part of this article is something of a retrospective on pre-Windows 10 technology, so feel free to skip that if you’re not interested. However I think that it provides a lot of valuable context for understanding why D3D12 is designed the way it is (which is of course one of the central themes of this series!), which is why I included it in the first place. It’s also possible that my understanding of the Windows driver model is incomplete or inaccurate in a few ways, since I’ve only ever been on the application side of things. If you’re a seasoned driver developer or OS engineer and you read something that causes you to make a face, please feel free to reach out and/or correct me in the comments.
The Past: XDDM and WDDM 1.x
When I first started learning the very basics of graphics programming, I was in my junior year of college back in 2005. Naturally I used the very latest in 3D graphics API’s to draw my excessively-shiny spheres, which at the time was D3D9 running on Windows XP. Things were rather…different back then. 3D rendering on the GPU still wasn’t really mainstream in terms of general application/OS usage, and was generally only used by games that expected to run in exclusive fullscreen modes. Technically it was possible to have two different programs simultaneously use D3D9 to render to two different windows, but the extent to which those two programs would cooperate and play nicely with each other could vary depending on the particular video card you were using, as well as the implementation details of its driver1. This was due to the fact that the Windows 2000/XP display driver model (known as XDDM, or XPDM) mostly let display drivers handle complex issues like scheduling command buffers for execution on the GPU, or managing GPU resource memory from multiple processes. Things were particularly rough on the memory/resource side of things, since the OS and drivers were working through the aging DirectDraw infrastructure. On top of that you still had the entire legacy GDI pipeline with its own driver stack, which was supposed to interoperate with D3D and DirectDraw.
All of this makes sense when you consider that it all grew organically from a world where 3D GPU’s were still a novelty intended for playing games, and 2D graphics accelerators were ubiquitous. However it was also quite clear that the landscape was rapidly changing by the time that Windows Vista was nearing release. 3D-capable video processors were now found even in low-end machines (thanks to “integrated” GPU’s such as the GMA series from Intel), and the growing programmability of GPU’s was causing intrepid programmers to explore the possibility of using those GPU’s for things outside the realm of 3D graphics for games. OS developers like Microsoft were also considering the idea of using the GPU’s 3D rendering capabilities as a core component of how they displayed UI on their desktops. In other words, GPU’s were really starting to grow up, which meant it was time for the OS/driver stack to grow up along with them. This is where WDDM comes in.
WDDM, which is short for “Windows Display Driver Model”, was the new driver stack that replaced XDDM/XPDM in all Windows versions starting with Vista. WDDM was quite a departure from the earlier models, in that it really started to treat the GPU and its on-board memory as a shared resource arbitrated by the OS itself. For instance, with WDDM the OS was now in charge of submitting command buffers to a GPU, while the driver merely provided hooks for building command buffers in its hardware-specific format, and then executing a command buffer scheduled by the OS. This allows the OS internal scheduler to decide when a particular program’s packet of work should be executed, potentially deciding that one program’s commands are more important than another program’s commands. In a similar vein, a global video memory manager now “owned” the on-board memory of the video card, with the driver again providing the necessary hooks that would allow the OS to move data from system memory to video memory (or vice versa). This helped to unify GPU memory management across all vendors, and removed the need for band-aids like the old MANAGED resource pool from D3D9 by effectively virtualizing all resources. The general flow of commands through the WDDM driver stack looked something like this:
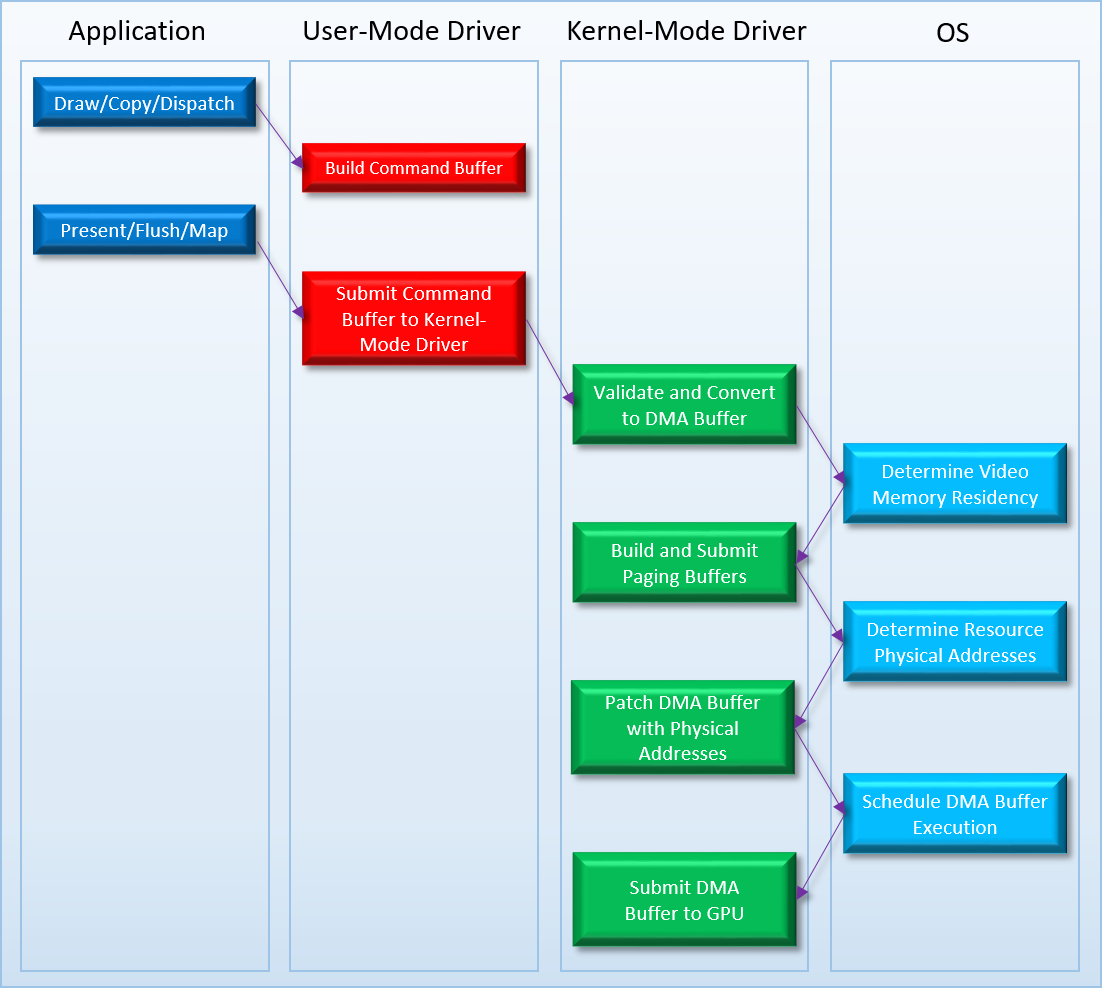
If you haven’t been a windows driver developer for the past 10 years, there’s probably a few steps in there that would make you raise an eyebrow. For instance, what the heck is a “DMA buffer”? It sounds like something fancy that might be related to hardware DMA units, but in reality it’s just what the OS calls command buffers on the kernel side of the user-mode/kernel-mode boundary. I suspect that the “DMA” part of that name comes from the fact that the GPU can directly read from a DMA buffer through a physical address, but I don’t actually know for sure. The step that you might find confusing is the one that’s labeled “Patch DMA Buffer with Physical Addresses”. At the time of WDDM 1.0, GPU’s had simple memory controllers that could only access their memory using physical addresses. This is rather unlike CPU’s, which have the capability to work with virtual addresses that are mapped to physical addresses using a page table. Having the vendor-supplied drivers work directly with physical addresses when dealing with resources like buffers or textures would generally be a Bad Idea for a few reasons, but under WDDM it’s a non-starter due to the fact that the OS’s video memory manager has the ability to move resources in and out of device memory as it sees fit. So to make things work, WDDM requires that the driver submit allocation and patch lists alongside DMA buffers. The allocation list tells the OS all of the resources that referenced by the commands inside the DMA buffer, which lets the memory manager decide which resources need to be resident in device memory. The patch list then tells the OS where all of the resources are actually referenced within the DMA buffer, which the OS then uses to patch the DMA buffer with physical addresses right before that buffer is executed on the GPU.
It should be obvious at this point that there was a whole lot going on behind the scenes whenever an app made a few draw calls! Fortunately D3D application developers only really had to worry about that left column, since everything in the other columns was generally hidden from you. In fact, the way that the D3D10/D3D11 API’s were written didn’t even directly expose the fact that GPU’s were parallel processors being fed by buffers full of command streams. For the most part you could pretend that your Draws and Dispatches were happening synchronously with your CPU commands, and you would still get correct results. The only time the abstraction really leaked through was if you looked at the actual timings of your calls, particularly if you hit a case that required the CPU to wait for the GPU to catch up. All things considered, writing D3D programs really got easier for application developers in the transition from D3D9 to D3D10/11, with some of the reasons why getting spelled out in this document. 2 Driver and OS developers weren’t so lucky, and things were certainly quite rocky back during the initial transition from XDDM to WDDM 1.0. But after years of refinements it seems to have proved its worth, as we now take it for granted that the desktop composites its windows using the GPU, or that Chrome can use GPU acceleration for rendering webpages while you’re simultaneously playing Battlefield 1 on highest settings.
While there were a lot of minor updates to WDDM over various Windows versions and service packs, there was one major improvement in Windows 8 that’s worth calling out. Starting in WDDM 1.2, drivers could now specify whether or not they supported preemption of their command buffers, and also what level of granularity they could prempt at. Drivers indicating their supporting by returning two enum values, one for graphics and one for compute. Looking at the compute enum, the possible values seem quite similar to the premption granularities that we discussed in the earlier articles:
typedef enum _D3DKMDT_COMPUTE_PREEMPTION_GRANULARITY {
    D3DKMDT_COMPUTE_PREEMPTION_NONE ,
    D3DKMDT_COMPUTE_PREEMPTION_DMA_BUFFER_BOUNDARY ,
    D3DKMDT_COMPUTE_PREEMPTION_DISPATCH_BOUNDARY ,
    D3DKMDT_COMPUTE_PREEMPTION_THREAD_GROUP_BOUNDARY ,
    D3DKMDT_COMPUTE_PREEMPTION_THREAD_BOUNDARY ,
    D3DKMDT_COMPUTE_PREEMPTION_SHADER_BOUNDARY
} D3DKMDT_COMPUTE_PREEMPTION_GRANULARITY;
As we discussed in earlier articles, finer-grained preemption can make for much nicer user experience when multitasking, especially when a particular program is really trying to hog the GPU.
UPDATE: it turns out that you can actually view your video card’s reported premption granularity by using the old DirectX Caps Viewer! These days its included as part of the Windows 10 SDK, so you can typically find it in C:\Program Files (x86)\Windows Kits\10\bin\
Problems With D3D11 and WDDM 1.x
I think it’s fair to say that from a D3D application developer’s point of view, things generally got better and easier when comparing the Windows XP era to the Windows 7 era. I’m sure driver and OS developers had plenty to complain about, but certainly in my day job as a game developer I appreciated the increased orthogonality of the API’s as well as the fact that multi-tasking generally “just worked” across a variety of hardware (including multiple GPU’s in the same machine!). But you should never underestimate the ability of a game programmer to complain about something (especially when it comes to Windows!), and we certainly found some things to gripe about. Pretty much all of them revolved around performance and multithreading.
Back when D3D11 was first announced, there was a lot of hype around the fact that it allowed for multi-threaded rendering via so-called deferred contexts. While this turned out to be technically true (it’s totally possible to have multiple threads issuing Draw and Dispatch calls in stock D3D11), in practice it wasn’t as useful as everyone hoped it would be. Probably the biggest roadblock is something that we discussed way back in part 1: it’s really tough (or perhaps impossible) to make implicit dependencies work in an efficient way when multiple threads are generating the rendering commands. If you’ve got to run through the entire set of commands for a frame to determine when a depth buffer transitions from being writable to being readable as a texture, it quickly pushes you down the path of serializing your command lists before final generation of the hardware command buffer. This is definitely not great if your goal was to distribute the cost of command buffer generation across multiple cores, which is really the only reason to use deferred command lists in the first place. So that was a pretty big bummer, and led to games (mostly) sticking to single-threaded rendering on Windows.
Another issue that has sprung up in recent years is D3D11’s inability to leverage multiple command processors/hardware queues on modern GPU’s. As we learned in Part 3, submitting commands into multiple front-ends can potentially lead to higher shader core utilization, which in turn leads to higher overall throughput. We also saw that effectively utilizing these additional command processors requires identifying and submitting multiple chains of commands that aren’t dependent on one another. Having the driver do this automatically is a big ask, especially when data dependencies are implicit rather than explicit. If you think about it, it’s very similar to utilizing multiple CPU cores via threads: the compiler can handle detecting dependencies within a single thread, but it doesn’t extract out independent sequences of instructions that would long enough to justify having the OS spin up a whole new thread. The problem is made even more difficult by the fact that command buffer building and submission is also implicit in D3D11/WDDM 1.x, which means there’s no place for the app to give hints or more explicit input about which front-end a stream of commands should be submitted to. On top of that GPU’s typically have restrictions on which commands can be executed on which command processors (for instance, some can only consume compute-oriented commands), and D3D11 has no way of expressing these restrictions through its API’s.
One last issue that I’ll discuss is less technical in nature, and has to do with the abstraction presented by the API and how it relates to deferred command lists. As I mentioned earlier, D3D11 adopts the model where command buffer recording and submission to the hardware is implicit based on an app’s sequence of D3D11 commands, and is completely hidden behind the driver. This also effectively hides the asynchronous/parallel nature of the GPU, and lets you assume that draw/dispatch/copy commands happen synchronously and still get correct results. Or at least, that’s the case if you’re using the immediate context. Deferred contexts break this abstraction, since their semantics imply that the commands aren’t actually executed right away and are instead executed when ExecuteCommandList is called on the immediate context. This basically works, but it’s also pretty odd when you consider that the immediate context isn’t really “immediate”, and is actually “deferred” with implicit submission. So really a deferred context was more of a double-deferred context! On top of that weirdness, deferred command lists also had some odd restrictions as a result of their user-facing execution model. In particular, the Map operation was restricted to write-only operations, and disallowed anything involving reading. This stems from the fact that commands on a deferred command list can’t be expected to execute (from an app point of view) until ExecuteCommandList was called, which in turn meant that you couldn’t expect to read the results of prior commands. This is actually similar to how things work now in D3D12 (more on that in a minute), but it’s a bit strange that those semantics only applied when doing multi-threading in D3D11. Finally, I suspect that the automatic memory management/versioning happening behind the scenes when using D3D11_MAP_WRITE_DISCARD really stretched things to their breaking point when having to support that in a multi-threaded, deferred context scenario. At some point it just makes more sense to let apps manage their memory and submission using the app’s own knowledge of its particular needs, which leads us to…
The Present: Windows 10, D3D12, and WDDM 2.0
With D3D12 and WDDM 2.0, the API and driver stack has pulled back much of the curtain around how work actually gets submitted to the GPU. Instead of abstracting away the fact that commands are getting recorded to buffers and executed asynchronously by a parallel processor, D3D12 (almost) directly exposes those details to applications. The API gives you an interface for recording commands (ID3D12GraphicsCommandList), another interface for storing the memory into which those commands are recorded (ID3D12CommandAllocator), and a function that allows you to queue a completed command list for execution (ExecuteCommandLists). Of course with this newfound power comes new responsibilities. Since the app is in the driver seat now, it means it has to now be aware of when those command buffers are in-flight so that it can avoid writing to them. This leads to a typical double-buffered “submission loop” where the application waits for the GPU to finish processing an old command buffer before re-using it:
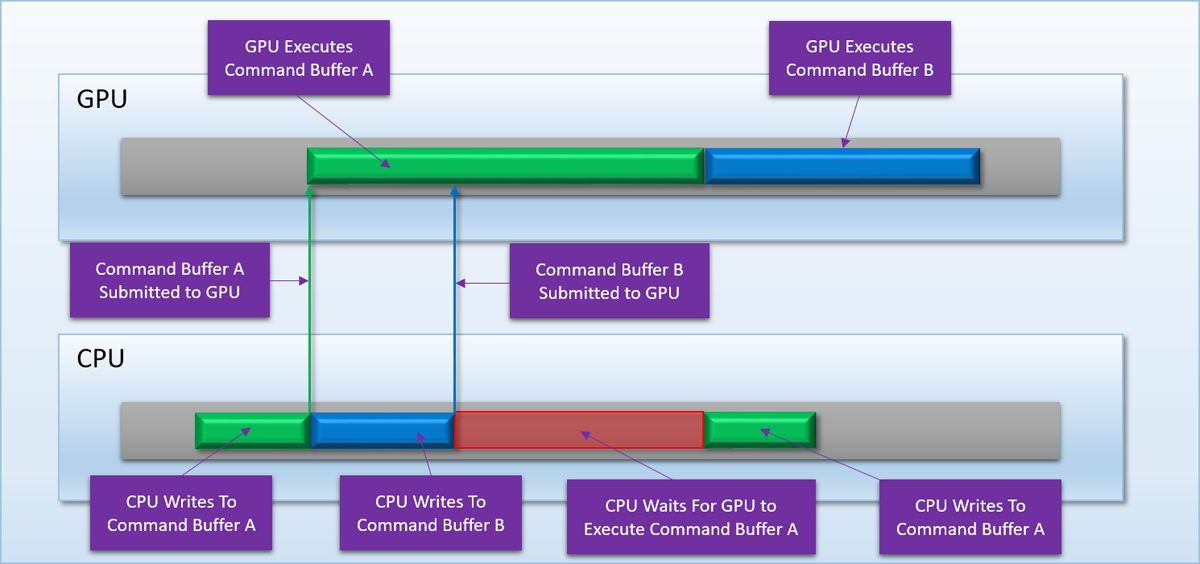
You generally deal with similar patterns all over the place when working with D3D12, since you’re now responsible for all lifetime management when it comes to memory and resources. No more MAP_DISCARD for you when update a constant buffer, instead you have to craft your own mechanisms for grabbing a safe bit of memory. And if you want to read back results from the GPU, you had best make sure that you’ve submitted the relevant command buffer and waited for it to complete before attempting to read that memory on the CPU. Like the barriers that we discussed in the first article, it’s quite a large burden that’s been shifted from the driver to the application. And the shift was mostly done for the same exact reason: to enable better efficiency and multithreading. The natural way to divide up command generation is to have each thread or task generate its own command buffer, and then submit them all as a “chain” when they’re all been recorded. When you combine this with explicit barriers and a single API for specifying pipeline state via PSO’s, you get an API that truly allows you parallelize command buffer generation across multiple CPU cores.
Providing more explicit control over submission also gives apps the ability to take advantage of GPU’s that have more than one front-end for queuing or processing commands. In Part 3, we talked about how adding an additional command processor to a GPU can help improve overall utilization for cases where an application submits multiple distinct dependency chains (commonly referred to asynchronous compute). If we were stuck in the old D3D11 model where dependencies and submission were implicit, it would be very difficult (or impossible) for a driver to be able to extract out a non-dependent chain of dispatches to execute on a second command processor. Fortunately with D3D12 we’re actually in a position to explicitly say “this list of commands can be executed separately, and depends on this other list of commands”, which can be done via command queues and fences. Command queues, like their name suggest, represent a single queue into which completed command buffers can be submitted for running on the GPU. When you create a command queue, you have to specify 1 of 3 different command list types to run on that queue:
- COPY - can execute CopyResource commands
- COMPUTE - can execute CopyResource and Dispatch commands
- DIRECT - can execute CopyResource, Dispatch, and Draw commands
These command list types can potentially correspond to different “engines” on the GPU, which is what D3D/WDDM like to call a command processor. Each engine can have its own distinct set of commands it can run, hence the 3 types of command lists. Typically a discrete GPU will have at least 1 graphics command processor capable of executing all possible commands, and at least 1 DMA unit that can issue copy commands that are optimized for transferring over the PCI-e bus. Many recent GPU’s also have additional compute-only command processors, but we’ll get into that in more detail later in this article.
As an example, let’s return to the post-processing case that we were discussing in Part 3:
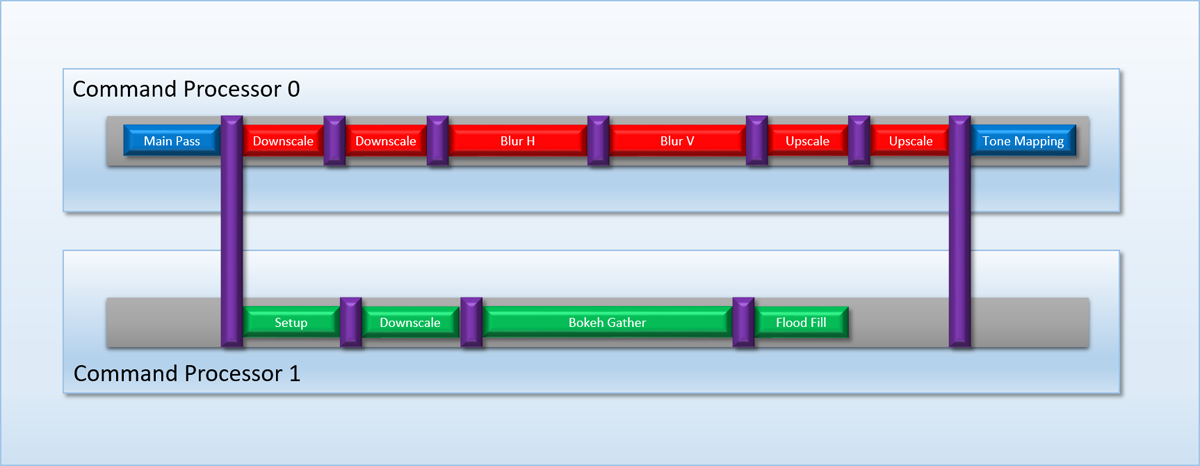
To submit our work in such a way that the two dependency chains could be executed on both command processors, we would do something like this in D3D12:
- Create a DIRECT command queue, which we’ll call GfxQueue
- Create 3 DIRECT command lists, which we’ll call GfxCmdListA, GfxCmdListB, and GfxCmdListC
- Create a COMPUTE command queue and command list, which we’ll call ComputeQueue and ComputeCmdList
- Create two fences, FenceA and FenceB
- Each frame:
- Record all rendering commands for the Main Pass to GfxCmdListA
- Record all bloom rendering commands to GfxCmdListB
- Record all tone mapping and subsequent rendering commands to GfxCmdListC
- Record all DOF dispatches to ComputeCmdList
- Submit GfxCmdListA to GfxQueue
- Signal FenceA from GfxQueue on completion of GfxCmdListA
- Submit GfxCmdListB to GfxQueue
- Tell ComputeQueue to wait for FenceA
- Submit ComputeCmdList to ComputeQueue
- Signal FenceB from ComputeQueue on completion of ComputeCmdList
- Tell GfxQueue to wait for FenceB
- Submit GfxCmdListC to GfxQueue
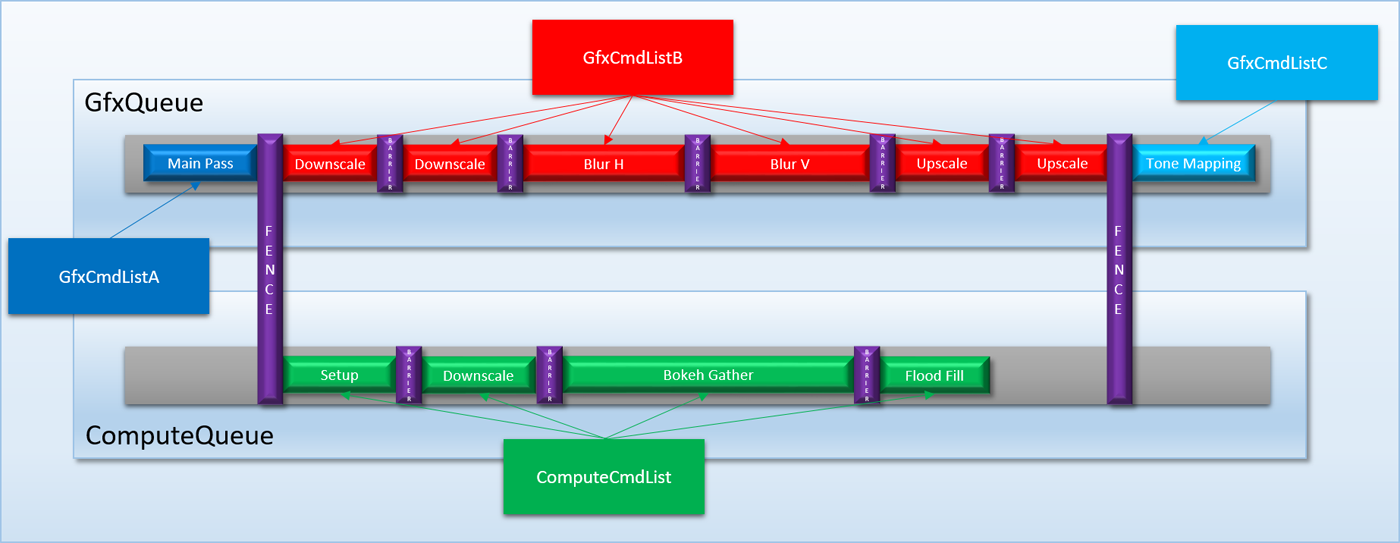
Since these D3D12 commands are very explicit about the dependencies between command lists as well as the kind of queue that the command lists should be submitted to, the OS and driver now have enough information to actually schedule the command lists on separate command processors. This is a major improvement over D3D11, whose implicit submission model didn’t really allow for this to occur.
Based on how the queue and submission API’s work, you may be tempted into thinking that submitting a command list to an ID3D12CommandQueue will directly submit the corresponding command buffer(s) to a hardware queue for a particular GPU front-end. But this isn’t really true in D3D12 and WDDM 2.0. When we were going over the details of WDDM 1.x, we discussed how the OS actually had its own software scheduler that was responsible for deciding when a command buffer should actually run on a GPU, and potentially arbitrating submissions from multiple applications. This is very much still the case in D3D12/WDDM2.0. Consequently you’re not submitting command buffers to a hardware queue, you’re instead submitting them to the OS’s scheduler. In addition to letting the OS handle shared resources between multiple applications, it also allows the OS to “virtualize” the queues for hardware that doesn’t actually support concurrent execution on multiple front ends (in D3D/WDDM terminology we would say that the GPU only has a single engine). If you look at the descriptions of the queue types that I listed above, you may have noticed that they’re set up such that each queue type’s list of supported commands is actually a subset of the next queue type’s supported commands. In other words, the DIRECT type can do everything you can do on a COMPUTE or COPY queue, and COMPUTE can do everything that you can do on a COPY queue:
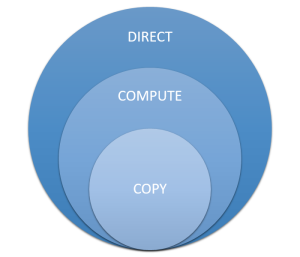
With the queue/engine functionality being specified as subsets of each other, the OS can take a submission from a COPY queue and redirect it to a DIRECT engine if it needs to. This saves applications from having to change how they submit their command buffers based on the supported functionality of the end-user’s hardware and drivers. However to pull this off, the OS has to be able to take command buffers that were intended to be concurrent and “flatten’ them down to a serial stream of command buffers. As an example, let’s return to the DOF/bloom case study that we used earlier. If we were to submit that sequence of command buffers on a GPU that only has a single DIRECT engine, the OS will have to flatten the submissions into something like this:
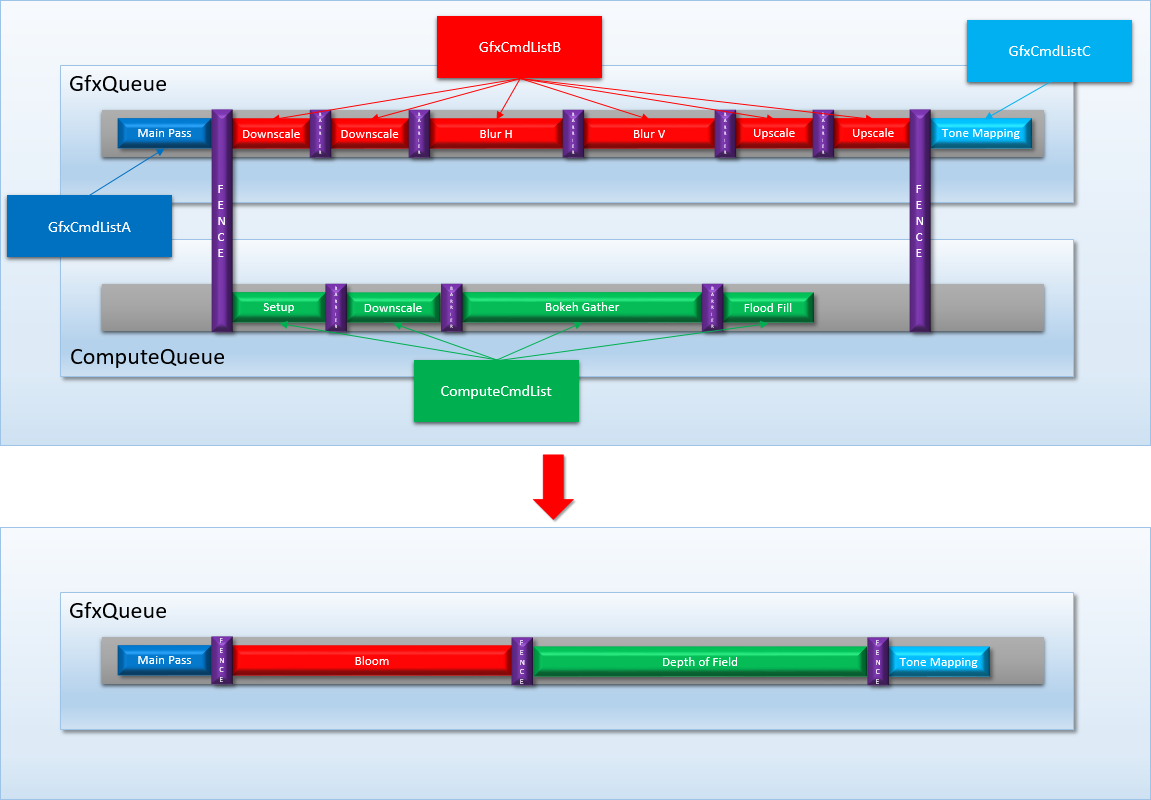
Since the bloom and DOF command buffers are independent of each other, they can be executed in any order with regards to other and still give the same results. However you can tell the OS scheduler to favor one queue’s submissions over the other by creating the queue with a higher-than-normal priority. We should also note here that the OS needs to be fully aware of inter-queue dependencies in order to do this kind of flattening operation, which is why fences are heavyweight OS-level constructs instead of being lightweight sync operations. This is also why you can’t perform cross-queue synchronization within a command list, which would be convenient for applications but would break the ability of the scheduler to flatten multi-queue submissions. One benefit gained from giving the OS global knowledge of submission dependencies is that it can detect and prevent certain deadlocks in advance., which is nicer than allowing the system to choke.
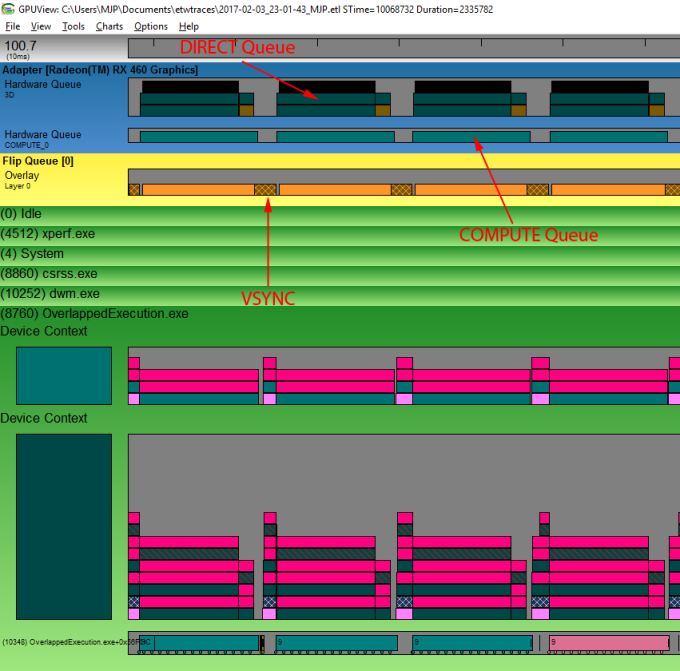
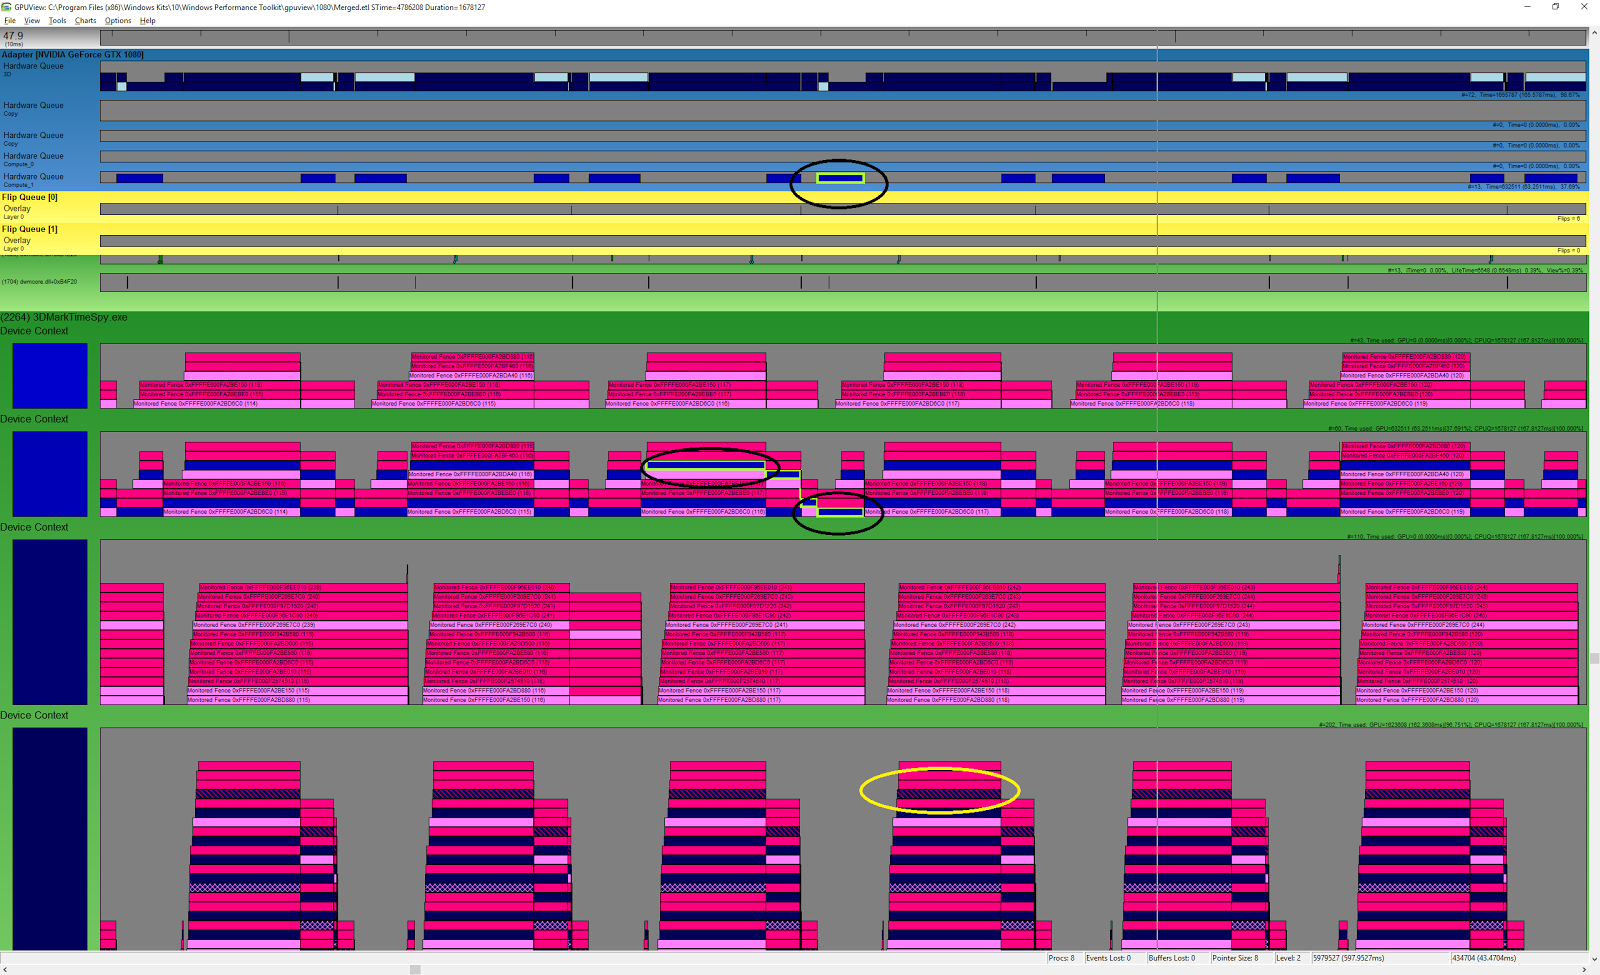
If you’re ever curious to see what the OS and scheduler are actually doing with your command buffers behind the scenes, the best way to do so is to use GPUView (which is most easily done by using Bruce Dawson’s invaluable UIforETW tool). Here’s an example capture from an submitting a bunch of work to both a DIRECT and COMPUTE queue running on an AMD RX 460:

This screenshot is showing about 4 frame’s worth of capture data, which you can tell by looking at the activity in the flip queue. The darker area shows where the GPU is idle while waiting for VSYNC, so we can use that denote where the frame begins and ends. Towards the bottom we have the “device contexts”, which is showing command buffers that have been submitted on the CPU side of things by a single process. The top one shows the compute submissions, while the bottom one is the graphics/direct submissions. All of these command buffers end up in the hardware queues at the top of the image, which is what we’re interested in. Here we see there’s two hardware queues, one called “3D” and the other called “COMPUTE_0”. By looking at the activity on these queues we can see that they’re both processing submissions simultaneously, which suggests that the work from each queue will overlap. Ultimately what we’re seeing here is pretty similar what I was illustrating in Part 4 with the GPU/Driver timelines, which means we can also use this tool to inspect preemption behavior from multiple applications.
For those of you using Vulkan, be aware that their queue/submission model does not work like D3D12’s! In Vulkan, every physical device can be queried to discover which queue “families” it supports (a queue family is analogous to an engine type in D3D12), as well as how many of each queue family is available. You can then pass handles to those exposed queues when creating your logical device, which then allows you to submit command buffers to those queues at runtime. This means that if a GPU only has a single front-end, you will probably only see a single queue exposed on the physical device.
There’s one more improvement in WDDM 2.0 that I wanted to quickly mention: remember how I described the process for patching command buffers with physical addresses in WDDM 1.x? That’s no longer necessary in WDDM 2.0 thanks to its added support for GPU virtual memory. With the new driver model, each process gets its own virtual address space for GPU memory, just like they do for CPU memory. The app and driver can freely embed these virtual addresses directly into command buffers or ExecuteIndirect argument buffers without having to go through an expensive patching process right before execution. This change also allows the user-mode driver to directly build and submit a GPU-accessible command buffer instead of requiring the kernel-mode driver to create a DMA buffer. This is a nice performance improvement, and I would imagine it’s also an improvement from a security point of view. When using the D3D12 API you often work directly with GPU virtual address for things like creating vertex buffer views or setting root CBV’s/SRV’s using a single pointer, which is pretty convenient for apps. Vulkan on the other hand doesn’t expose GPU virtual addresses (likely because it has to run on platforms and hardware without full virtual memory support), so it will instead work with allocation/offset pairs.
A Quick Look at Real GPU’s
Before we wrap up this article, I wanted to also spend just a bit of timing looking at real-world GPU’s and their support for multiple command processors. In Parts 2, 3, and 4 we used my made-up GPU to look at how the basics of preemption and overlapped processing worked. But I wanted to also go over some real-world examples to see how they compare to my overly-simplified example, and also how they relate to D3D12’s support for multi-queue submission.
Let’s start out by looking at GPU’s from AMD’s. Take a look at this slide from one of AMD’s presentations:
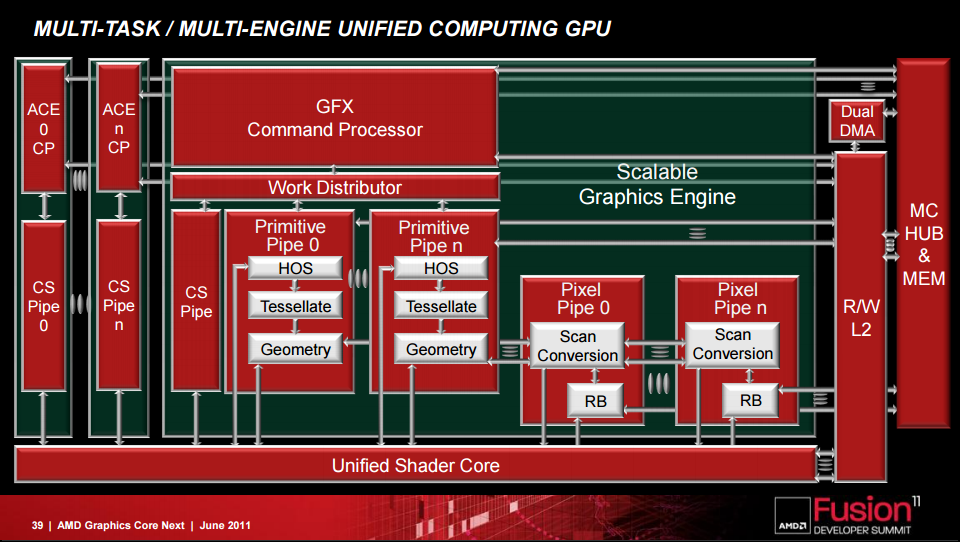
In this diagram there’s one “GFX” command processor, which is is the only command processor capable of issuing Draw commands that use the primitive and pixel pipes. It can also issue Dispatch calls that use the CS pipeline to access the shader cores. In the top left there are a few units labeled “ACE”, which stands for “Asynchronous Compute Engine”. These guys are basically an array of simplified, independent command processors that can only process compute-related commands. This means that they can issue Dispatch calls and perform synchronization-related commands, but they can’t execute Draw commands that utilize the graphics pipeline. In other words, they exactly fit the required feature set of a COMPUTE engine in D3D12, which is obviously not a coincidence. In terms of functionality they’re also rather similar to the dual command processors of my fictional MJP-4000, and they can provide the same benefits for preemption, multitasking, and increased utilization from overlapping multiple workloads. In fact, if you read some of AMD’s documentation you’ll see them explain some of the same concepts that I was discussing in my earlier articles.
In practice the ACE’s are a bit more sophisticated than what was discussed in my examples, particularly due to the fact that each ACE contains up to 8 hardware queues for feeding command buffers to the ACE’s command processor. AMD’s processors support up to 8 ACE’s on a single chip, potentially allowing for 64 different command streams to be in-flight simultaneously! The separate queues support various scheduling and synchronization operations, effectively allowing them to serve as a very simple hardware task scheduler. These ACE’s have been present through every revision of the GCN architecture, including the recent RX Vega series. AMD has also mentioned a few improvements over the course of 4 architecture revisions. Most notably for their semi-recent Polaris architecture, the ACE’s were augmented with what they call a “Quick Response Queue”. Their documentation suggests that this allows ACE’s to submit high-priority workloads that take priority over work submitted from other command processors, which should allow for the kind of thread-level preemption that I showed in own preemption examples. Polaris also introduced what they called a “Hardware Scheduler” (HWS), which is described as additional independent processors that can be used to create a layer of virtualization around the physical hardware queues.
UPDATE: It turns out that the Quick Response Queue has been around since GCN2, and HWS has been around since Fiji/GCN3. Thanks again to Locuza for correcting me on that.
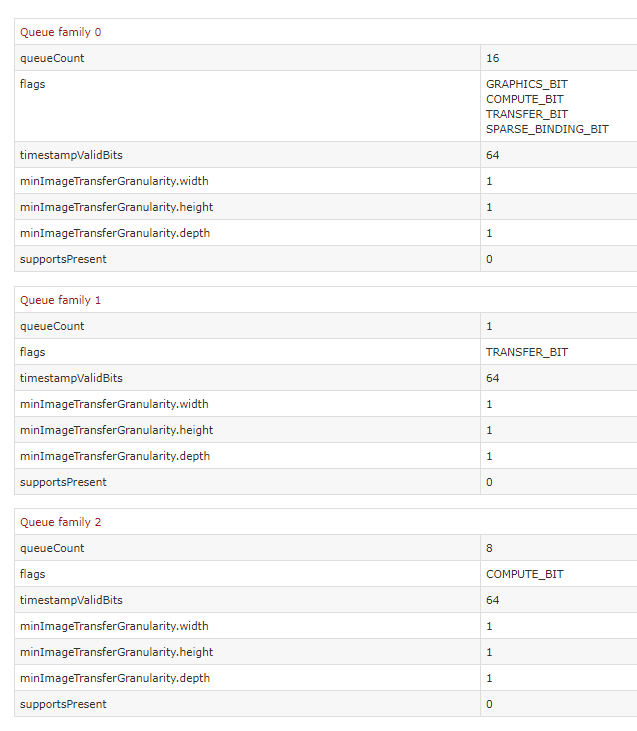
This information suggests that we should see at least 1 compute engine exposed to Windows scheduler, as well as at least 1 queue with COMPUTE_BIT set being exposed on the physical device through Vulkan. The D3D12 side can be verified through experimentation by using ETW captures and GPUView (see the image that I posted above showing a COMPUTE submission being executed on a hardware compute queue), but for Vulkan we can verify very easily using the Vulkan Hardware Database. Here’s what we get when looking at the “Queue families” tab of an RX Vega:
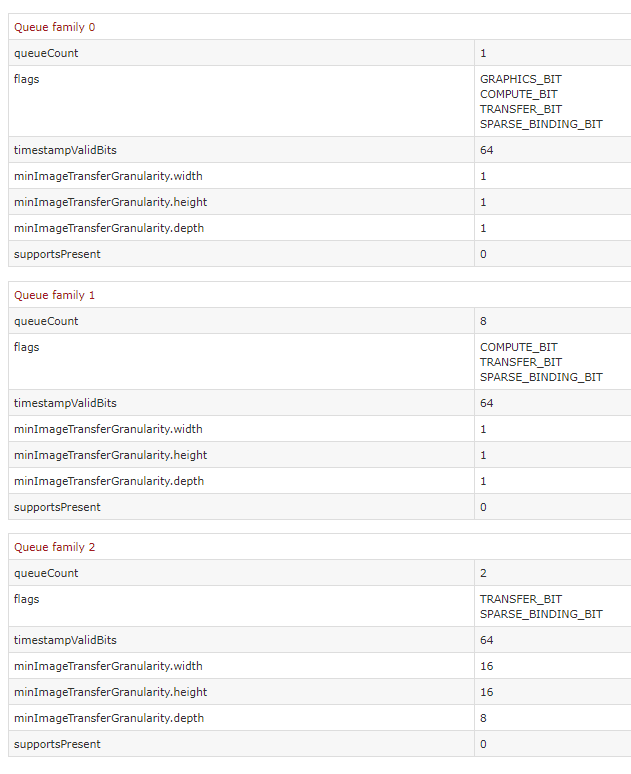
It looks like AMD chose to expose their ACE’s to Vulkan as 8 compute queues, which is plenty for an individual application. We can also see 2 queues with TRANSFER_BIT specified, which is Vulkan’s version of a COPY queue. These correspond to the hardware DMA units that are present on an AMD Vega, as well as on virtually every discrete PC video card in the wild. Like I mentioned earlier, DMA units on GPU’s are specifically optimized for transferring batches of data across the PCI-e bus into on-board GPU memory. The typical use case is read-only textures and buffers, which need to live in on-board memory in order for the GPU to be able to read from them with full bandwidth. Drivers from the pre-D3D12 days would use the DMA to perform initialization of resources with app-specified memory, since the DMA unit is optimized for transferring from system memory, and also because it can execute concurrently with graphics operations. DMA units can also transform textures into hardware-specific layouts, which typically involves using some variant of a Z-order curve to obtain better 2D cache locality. With D3D12 and Vulkan you’re of course on your own when initializing resources, and a COPY queue is the natural choice for doing this on discrete GPU’s.
As for Nvidia, their hardware also appears to feature functionality that allows for simultaneously submitting multiple workloads to their GPUs. Their Kepler architecture introduced what they refer to as Hyper-Q, which sounds pretty similar to the ACE’s on AMD GPUs:
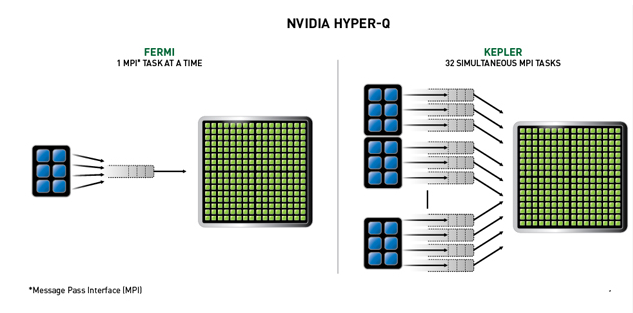
Their (very limited) documentation describes 32 hardware queues, and mentions that they can be used to submit multiple kernels from the same application or to allow multiple CUDA applications to submit workloads concurrently. Unfortunately it seems this functionality was limited only to CUDA, since comments from Nvidia indicated that their GPU’s could not simultaneously execute Hyper-Q commands alongside graphics commands. According to Nvidia, only their then-recent Maxwell 2.0 architecture was capable of running in a “mixed mode”, where 1 hardware queue could process graphics commands while the other 31 queues could simultaneously process compute commands. In theory this would allow for similar capabilities to AMD’s hardware, however it appears that Nvidia never exposed the additional compute queues through either D3D12 or Vulkan, and instead allowed the OS to merge compute submissions onto the graphics queue. It wasn’t until Nvidia released their more recent Pascal architecture that they decided to finally offer a bit of information on the subject. Their whitepaper has a section describing a new feature that they refer to as “dynamic load balancing”, which contains the following diagram and text on page 14:
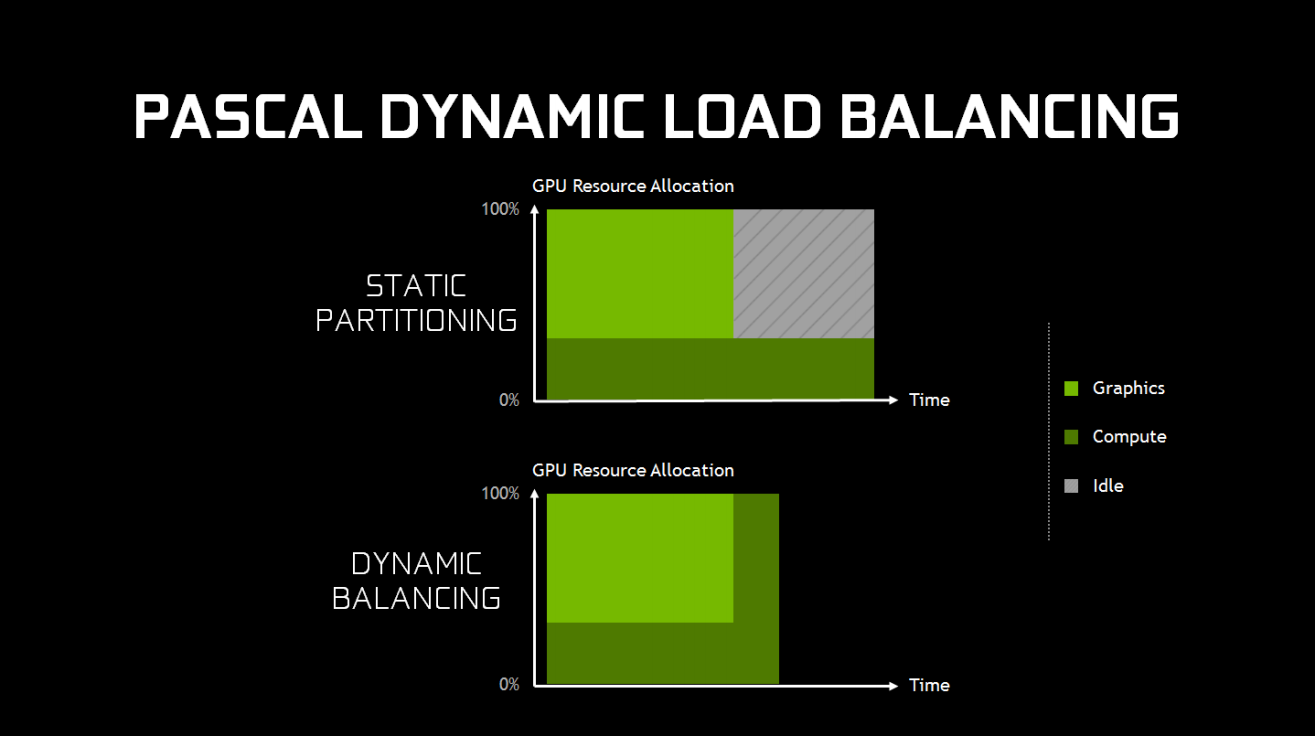
“In Maxwell generation GPUs, overlapping workloads were implemented with static partitioning of the GPU into a subset that runs graphics, and a subset that runs compute. This is efficient provided that the balance of work between the two loads roughly matches the partitioning ratio. However, if the compute workload takes longer than the graphics workload, and both need to complete before new work can be done, and the portion of the GPU configured to run graphics will go idle. This can cause reduced performance that may exceed any performance benefit that would have been provided from running the workloads overlapped.”
This suggests that the issue wasn’t in their queues, but perhaps in the actual functional units that would execute the compute shaders. From their description, it sounds as though their hardware units needed to be configured as either “graphics” or “compute” mode (perhaps on the SM level), which meant that for compute to overlap with graphics the hardware needed to be statically partitioned. This isn’t optimal, and it explains why they may have decided it was better off to just serialize compute queue submissions into the graphics submissions. Meanwhile the Pascal architecture sounds as though it can re-partition dynamically, which would make concurrent compute execution more feasible. This can be confirmed by noting that Pascal GPU’s will execute COMPUTE submissions on a compute hardware queue when viewed in GPUView, or by looking at the exposed queues in Vulkan:
We see 8 compute queues exposed here, which matches the RX Vega. Interestingly we also see 16(!) queues with GRAPHICS_BIT set, which is also very intriguing! Unfortunately Nvidia’s hasn’t said much on the hardware that’s backing these queues, so we’ll have to wait and see if we learn more in the future.
There are also pages later in the Pascal whitepaper that provide some details on its thread-level preemption capability, which is a big improvement on the draw-level preemption supported by the earlier Maxwell 2.0 architecture. Interestingly it seems their hardware also features instruction-level preemption, but only for CUDA. As far as I know there hasn’t been any information released about the queues on their newer Volta or Turing architectures, so we’ll probably have to wait a while to see if there have been any improvements.
Intel’s Gen9 architecture that was used in their Skylake CPU’s does not appear to have anything beyond a single DIRECT/graphics engine exposed through either D3D12 or Vulkan. GPUView only shows 1 hardware queue processing commands, and the Vulkan DB only shows 1 queue being exposed on the physical device. Unfortunately I don’t have access to a Gen 9.5 GPU (used on Kaby Lake), so I haven’t been able to personally test it. However it appears that these GPU’s still only expose a single queue in Vulkan, so I would assume that nothing has changed on that front. Not having even a COPY engine on these GPU’s might seem strange at first, but remember that DMA units are mainly a feature of discrete video cards. Integrated GPU’s like Intel’s utilize CPU memory instead of dedicated video memory, which means that the CPU can write that memory instead of requiring a dedicated hardware unit.
Next Up
For the sixth (and final!) part of this series, I’m going to share some results that I’ve gathered from experimenting with overlapped GPU commands and GPU preemption.
Comments:
Brian -
Thank you for this wonderful series!
#### [Daan Niphuis](https://plus.google.com/104552714963779816079 "dniphuis@gmail.com") -
I just want to say thanks for this insightful series of posts.
#### [Breaking Down Barriers – Part 1: What’s a Barrier? – The Danger Zone](../breaking-down-barriers-part-1-whats-a-barrier/ "") -
[…] Synchronizing GPU Threads Part 3 – Multiple Command Processors Part 4 – GPU Preemption Part 5 – Back To The Real World Part 6 – Experimenting With Overlap and […]
#### [Breaking Down Barriers – Part 2: Synchronizing GPU Threads – The Danger Zone](https://mynameismjp.wordpress.com/2018/04/01/breaking-down-barriers-part-2-synchronizing-gpu-threads/ "") -
[…] Synchronizing GPU Threads Part 3 – Multiple Command Processors Part 4 – GPU Preemption Part 5 – Back To The Real World Part 6 – Experimenting With Overlap and […]
#### [Breaking Down Barriers – Part 3: Multiple Command Processors – The Danger Zone](https://mynameismjp.wordpress.com/2018/06/17/breaking-down-barriers-part-3-multiple-command-processors/ "") -
[…] Synchronizing GPU Threads Part 3 – Multiple Command Processors Part 4 – GPU Preemption Part 5 – Back To The Real World Part 6 – Experimenting With Overlap and […]
-
Successful cooperation and stability also depended on how well the programs themselves handled the infamous lost device state that occurred in certain scenarios, most notably when alt-tabbing from fullscreen. ↩︎
-
That document briefly mentions one of biggest changes brought about by WDDM, which is the fact that IHV’s now had to provide a user-mode driver component alongside their kernel-mode driver. This was a really big deal at the time, since under XDDM the IHV only provided a kernel-mode driver. This meant that anytime the driver had to process a draw call or do some state management, the application had to undergo an expensive user-mode -> kernel mode context switch. The lack of a user-mode driver component was commonly cited as a reason as to why OpenGL could “handle more draw calls” than D3D9, and why D3D10 would be a major improvement for CPU performance. The concept of a user-mode driver also came just in time for everyone to fully adopt programmable shaders for everything, since drivers now frequently host complex optimizing compilers in their DLL’s so that they can JIT-compile shader bytecode. ↩︎