Breaking Down Barriers - Part 2: Synchronizing GPU Threads
This is Part 2 of a series about GPU synchronization and preemption. You can find the other articles here:
Part 1 - What’s a Barrier?
Part 2 - Synchronizing GPU Threads
Part 3 - Multiple Command Processors
Part 4 - GPU Preemption
Part 5 - Back To The Real World
Part 6 - Experimenting With Overlap and Preemption
Welcome to part 2 of the series! In the previous article, I explained the basics of what a barrier is, and talked about the various reasons for why you need to use a barrier on a GPU. One such use case that I brought up was to ensure that the many threads kicked off by a Draw or Dispatch call don’t overlap with previous Draw/Dispatch’s threads when there’s some kind of dependency between the two calls. In this article I’m going to dive into the specifics of how GPU’s handle this kind of synchronization, and also discuss the high-level performance implications of these approaches.
Programming the MJP-3000
To explain the basics of GPU thread synchronization, I’m going to walk through some examples using a completely fictional architecture: the MJP-3000. This made-up GPU is much simpler than real graphics hardware, which will (hopefully) make it easier to demonstrate high-level concepts without getting lost in the weeds. I also don’t want to give the impression that what I describe is exactly how real GPU’s do things, especially since many of those details aren’t publicly available. However the commands and behavior are still loosely based on real-world GPU’s, since otherwise the example wouldn’t be very useful!
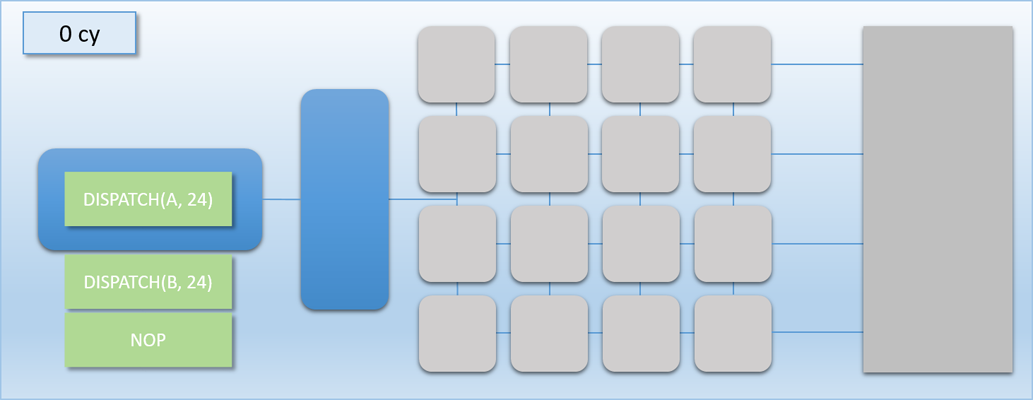
With the prologue out of the way, let’s have a look at the amazing feat of engineering that is the MJP-3000:
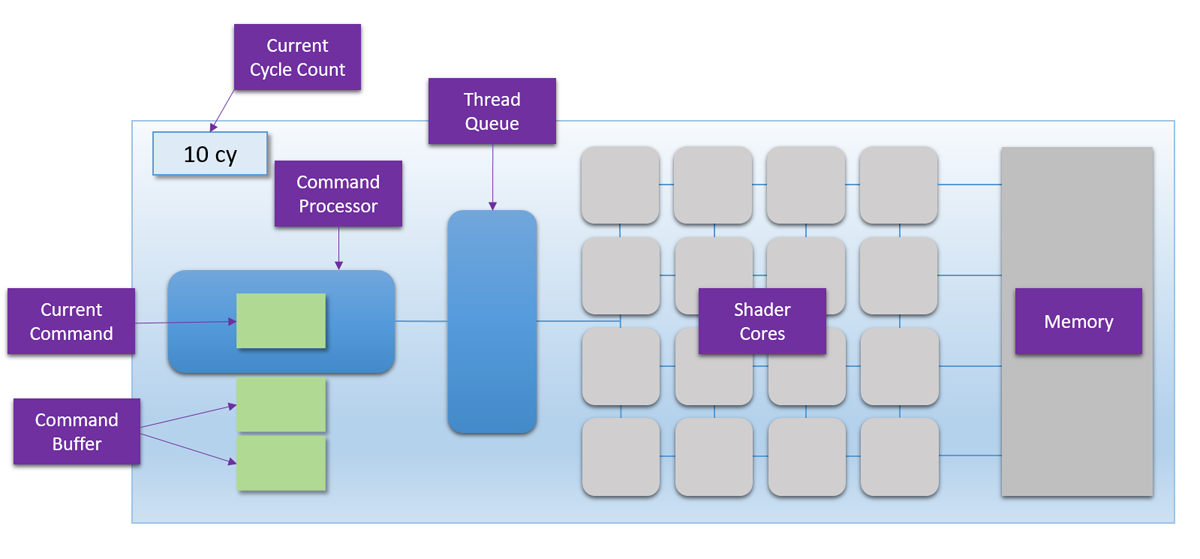
The interesting parts here are the command processor on the left, and the shader cores in the middle. The command processor is the brains of the operation, and its job is to read commands (the green blocks) from a command buffer and coordinate the shader cores. The command processor reads commands one at time from the command buffer, always in the exact order they’re submitted. When the command processor encounters the appropriate commands, it can add a group of threads to the thread queue immediately to the right of the command processor. The 16 shader cores pull threads from this queue in a first-in first-out (FIFO) scheme, after which the shader program for that thread is actually executed on the shader core. The cores are all identical, and completely independent of each other. This means that together they can simultaneously run 16 threads of the same shader program, or they can each run a thread from a completely different program. The shader cores can also read or write to arbitrary locations in device memory, which is on the right. Since the cores are independent and can all access memory, you can think of the array like a 16-core CPU. The major difference is that unlike a CPU they can’t tell themselves what to do, since they instead rely on the command processor to enqueue work for them. The Current Cycle Count in the top-left corner shows how many GPU cycles have executed for a particular example, which will help us keep track of how long it took for a particular example to complete execution.
For some reason, the designers of the MJP-3000 decided that their hardware could only run compute shaders. I suppose they felt that it would make things a lot simpler to only focus on the one shader stage that doesn’t rely on a complicated rasterization pipeline. Because of that, the command processor only has 1 command that actually kicks off threads to run on the shader cores: DISPATCH. The DISPATCH command specifies two things: how many threads need to run, and what shader program should be executed. When a DISPATCH command is encountered by the command processor, the threads from that dispatch are immediately placed in the thread queue, where they are grabbed by waiting shader cores. Since there are 16 cores, only 16 threads can be executing at any given time. Any threads that aren’t running on the shader cores stay in the thread queue until a core finishes a different thread and pulls the waiting thread out of the queue. The command processor can parse a DISPATCH command and enqueue its threads in 1 cycle, and the shader cores can dequeue a thread from the thread queue in 1 cycle.
Dispatches and Flushes
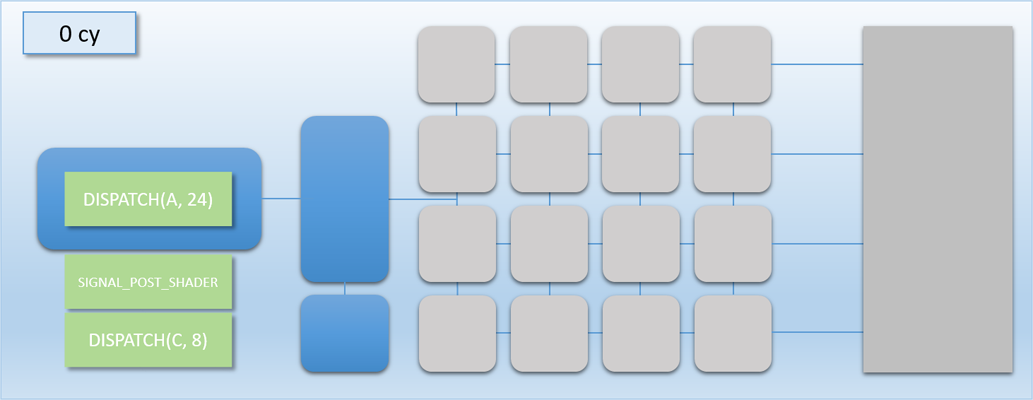
Let’s now try a simple example where we dispatch 32 threads that each write something to a separate element of a buffer located in device memory. This dispatch will run shader program “A”, which takes 100 cycles to complete. So with 16 cores we would expect the whole dispatch to take around 200 cycles from start to end. Let’s go through the steps:

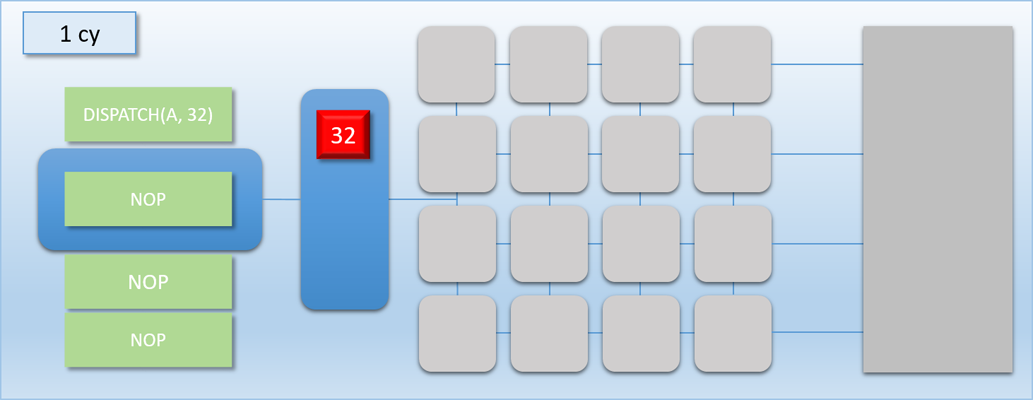

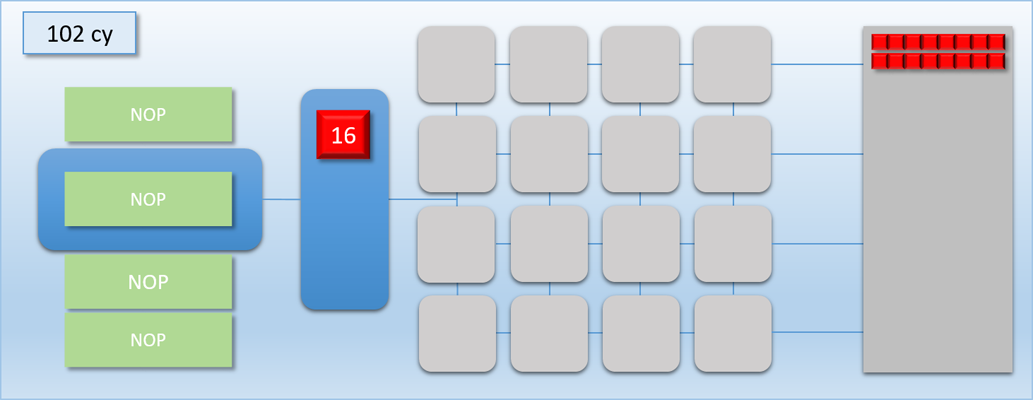
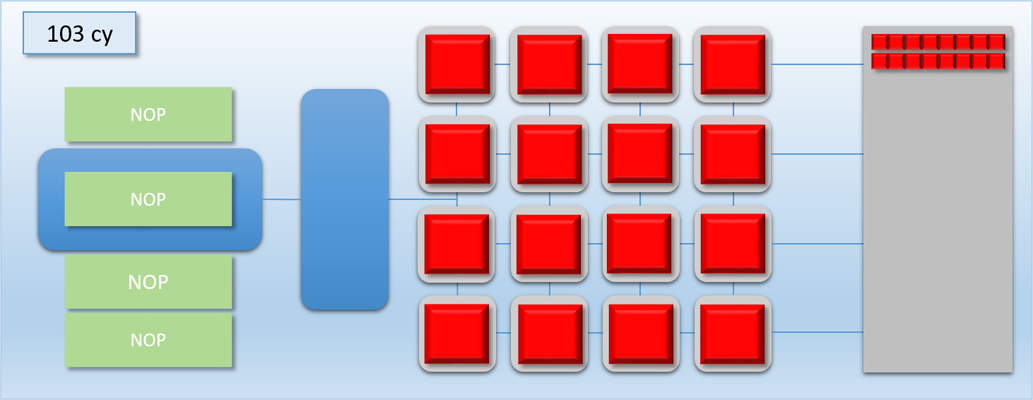

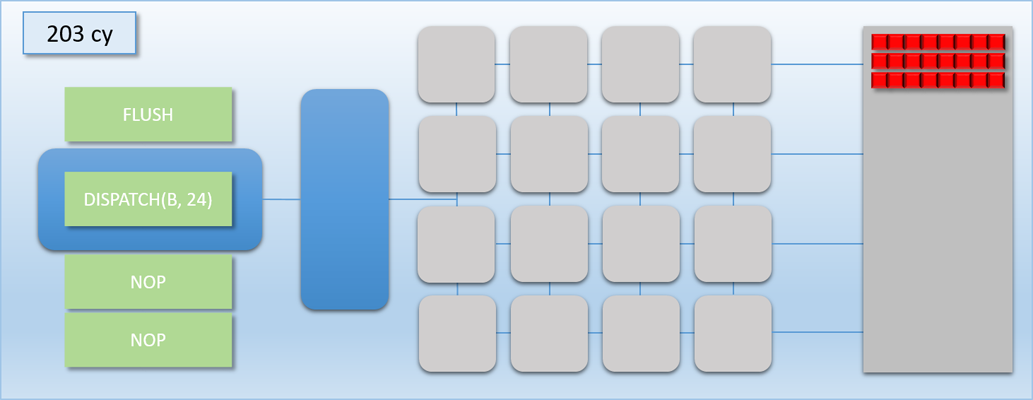
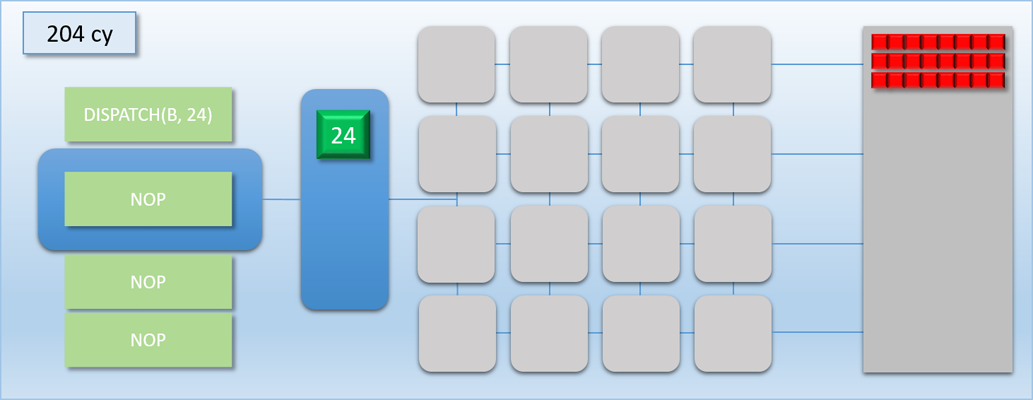
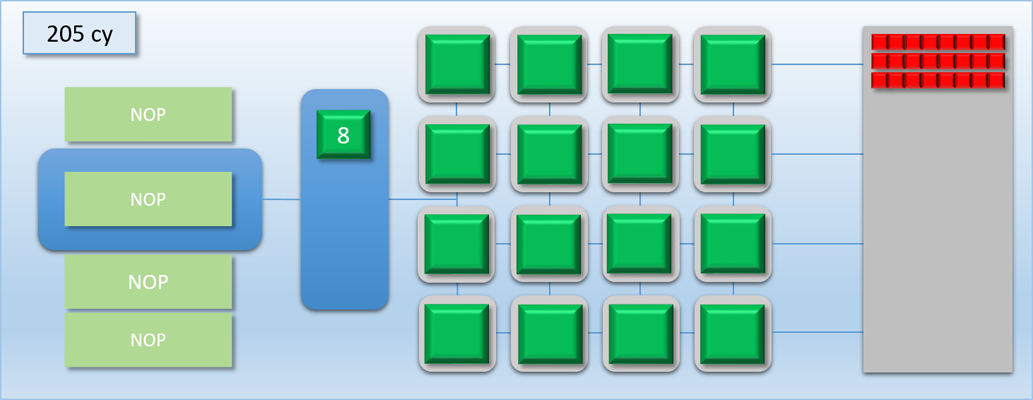
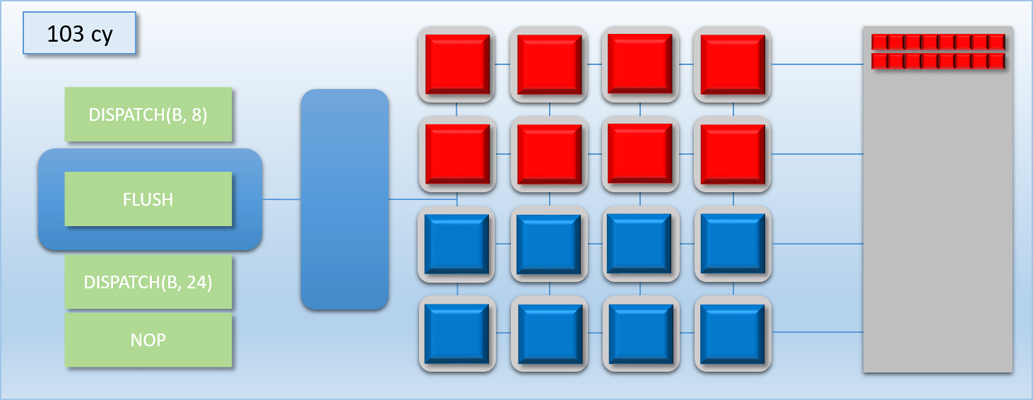
In the first step, the command processor encounters a DISPATCH command in the command buffer that requests 32 threads of program A. 1 cycle later, the command processor has enqueued the 32 requested threads in the thread queue. 1 cycle after that, the 16 shader cores have each picked up a thread of program A and have started executing them. Meanwhile, 16 threads are left in the queue. 100 cycles later the first batch of threads have completed, and their result is in memory. 1 cycle after that we’re at the 103 cycle count, and the second batch of 16 threads are pulled from the now-empty queue to start executing on the shader cores. Finally after a total of 203 cycles, the threads are all finished and their results are in memory.
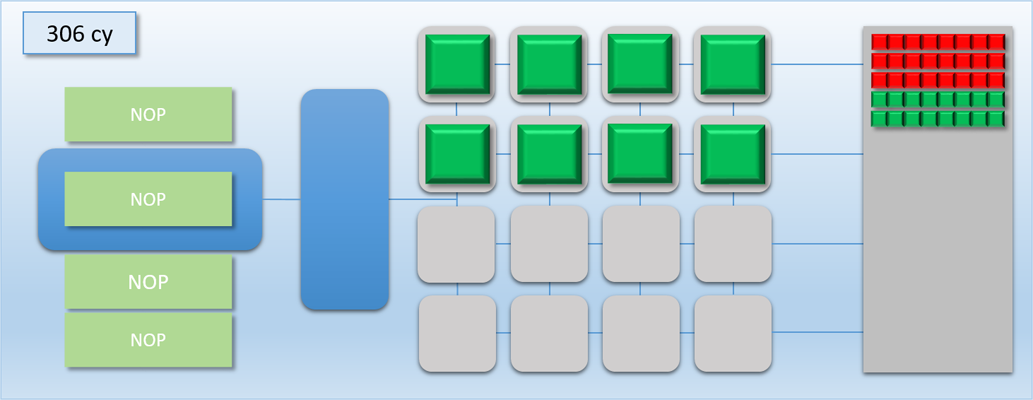
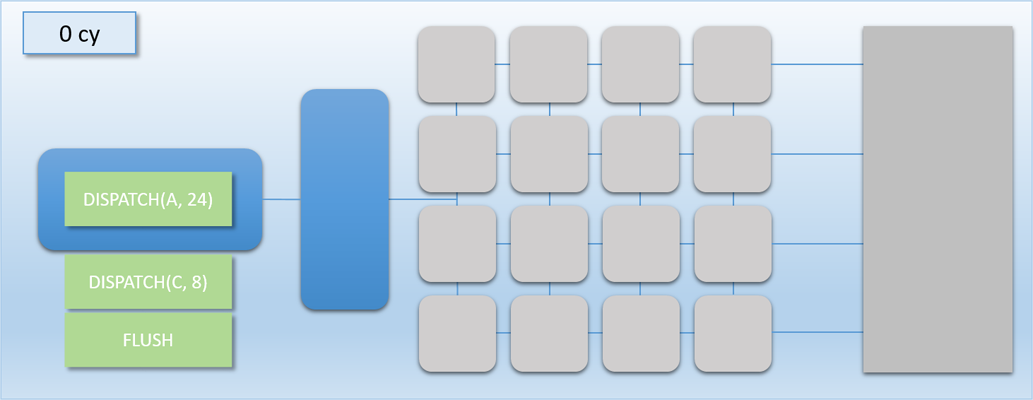
Now that we understand the basics of how this GPU works, let’s introduce some synchronization. As we already know from the previous article, synchronization implies that we’re going to somehow wait for all of our threads to hit a certain point before continuing. On a GPU where you’re constantly spinning up lots of new threads, this actually translates into something more like “wait for all of the threads from one group to finish before the threads from a second group start executing”. The common case where we’ll need to do this is where one dispatch needs to read the results that were written out by another dispatch. So for instance, say we run 24 threads of program A that collectively write their results to 24 elements of a buffer. After program A completes that we want to run 24 threads of program B, which will then read those 24 elements from the original output buffer and use them to compute new results written into a different buffer. If we were to try to do this by simply putting two DISPATCH commands in our command buffer, it would go something like this (program A is red, and program B is green):

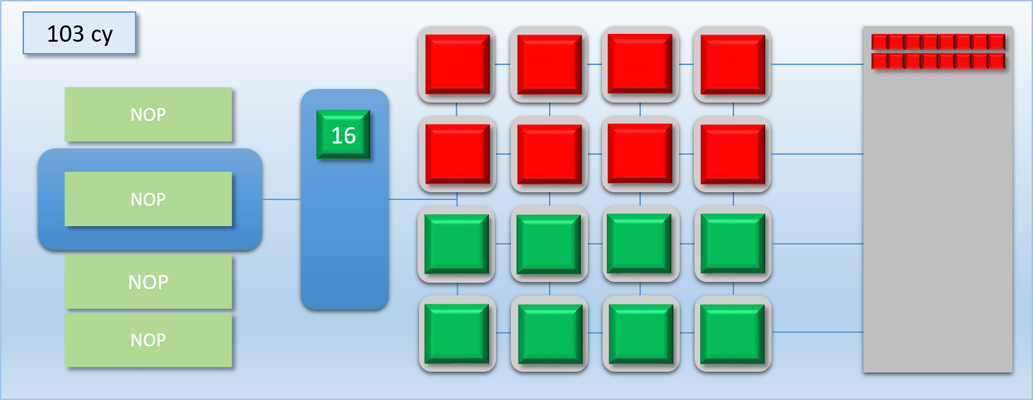

Take a look at the the third step: since dispatch A wasn’t a multiple of 16, the bottom 8 shader cores pulled from dispatch B to keep the cores from going idle. This caused the two dispatches to overlap, meaning that the end of dispatch A was still executing while the start of dispatch B was simultaneously executing. This is actually really bad for our case, because we now have a race condition: the threads of dispatch B might read from dispatch A’s output buffer before the threads of dispatch A have finished! Without knowing the specifics of which memory is accessed by programs A and B and how exactly the threads execute on the GPU, we have no choice but to insert a sync point between the two dispatches. This sync point will need to cause the command processor to wait until all threads of dispatch A run to completion before processing dispatch B. So let’s now introduce a FLUSH command that will do exactly that: when the command processor hits the flush, it waits for all shader cores to become idle before processing any further commands. The term “flush” is common for this sort of operation because it implies that it will “flush out” all pending work that’s waiting to execute. Let’s now try the same scenario again, this time using a flush to synchronize:


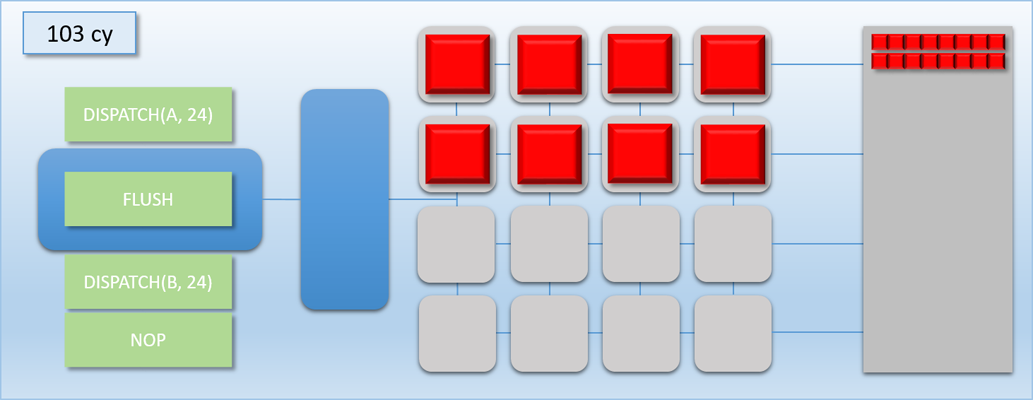
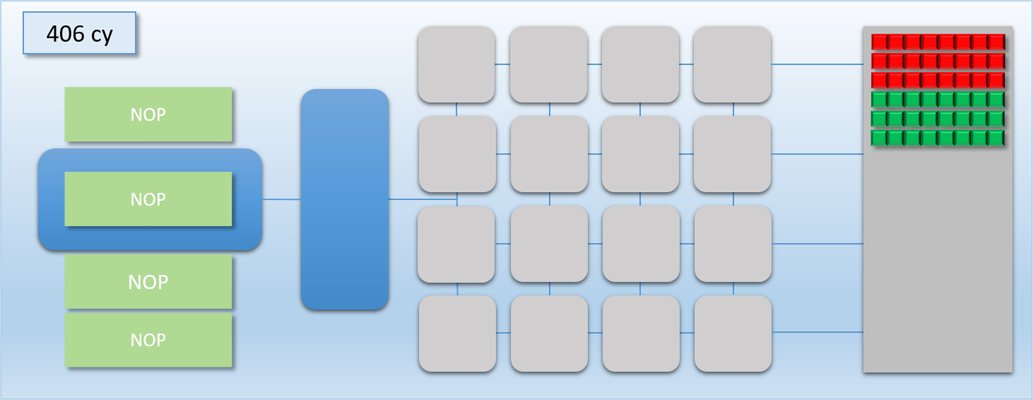
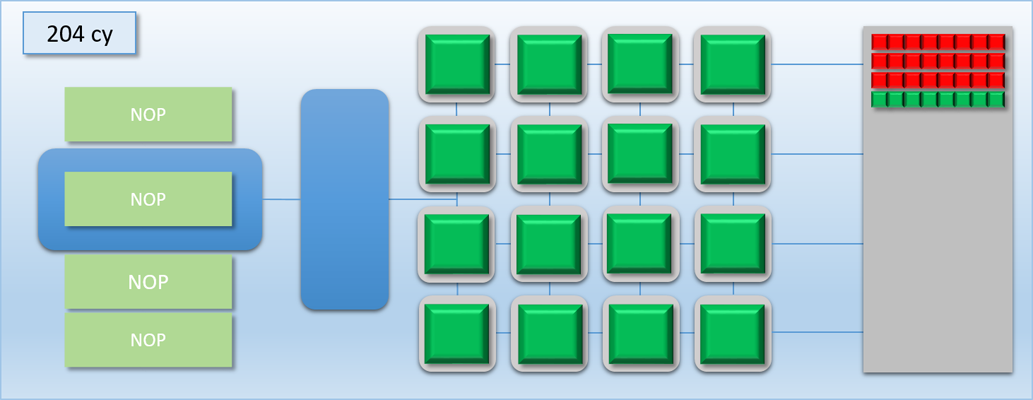
Notice how the command processor hits the FLUSH command, and then stops reading commands until dispatch A is completely finished and the thread queue is empty. This ensures that dispatch B never overlaps with dispatch A, which means it will be safe for any thread in dispatch B to access any result that that was output by dispatch A. This is pretty much exactly what I was talking about in part 1 when I mentioned the need for barriers to prevent dependent Draw/Dispatch calls from overlapping. In fact, you can usually expect something like a FLUSH to happen on current GPU’s if you issued dispatch A, issued a barrier to transition the output buffer from a write state to a read state, and then issued dispatch B (it’s also similar to what you would get in response to issuing a D3D12_RESOURCE_UAV_BARRIER in D3D12, since that also implies waiting for all pending writes to finish). Hopefully this example makes it even more clear as to why a barrier is necessary for this sort of data dependency, and why results could be wrong if the barrier is omitted.
It’s also very important to note that in this case the flush/barrier was not free from a performance point of view: our total processing time for both dispatches went from 304 cycles to 406 cycles. That’s a 25% increase! The reason for this should be intuitive: with the flush between dispatches, we now have more idle shader cores during the tail end of both dispatches. In fact the increase in processing time is exactly the same as the increase in the amount of idle time: without the flush we had about 0% idle cores over both dispatches, but with the flush our cores were idle about 25% of the time on average. This leads us to a simple conclusion: the performance cost of a flush is directly tied to the decrease in utilization. This ultimately means that the relative cost of introducing a thread synchronization barrier will vary depending on the number of threads, how long those threads execute, and how well the threads can fully saturate the available shader cores. We can confirm this with a simple thought experiment: imagine we ran dispatch A and dispatch B with 40 threads each instead of 24. The process would go almost exactly as it did before, except both dispatches would have another “phase” of 100 cycles where all 16 cores were in-use. Without our barrier the whole process would take about (40 + 40) / 16 = 500 cycles, while with the barrier it would take about 600 cycles. Therefore the relative cost of the barrier is about 16.5% as opposed to the 25% cost when our thread counts were lower.
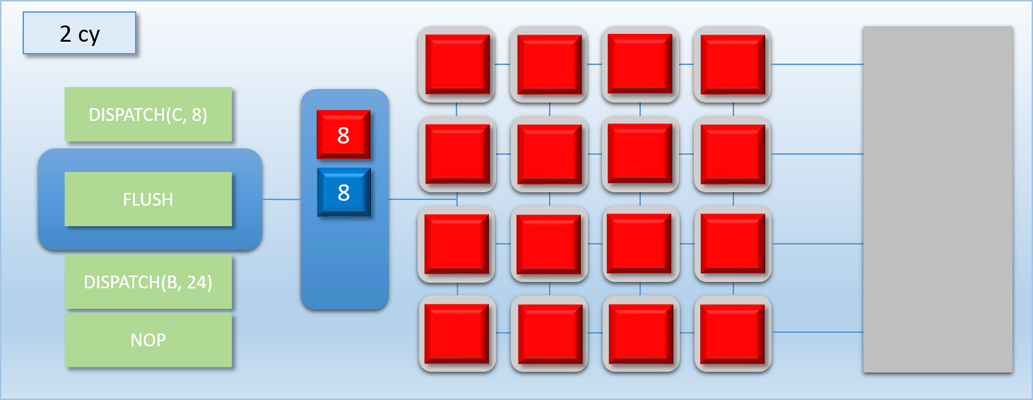
The other way to look at this is that removing an unnecessary flush can result in a performance increase that’s relative to the amount of idle shader cores. So if we’re syncing between two dispatches and they have no dependency between them, it’s most likely a good idea to remove the barrier and let them overlap with each other. For larger dispatches (in terms of thread count) that can saturate the GPU on their own there won’t be much benefit, since there won’t be much idle time to exploit. However for very small dispatches the difference can be significant. This time let’s imagine that dispatch A and B both have 8 threads each. With a flush in between the total time will be about 200 cycles, but with no flush they can perfectly overlap and finish in only 100 cycles! Or as another example, imagine we had another completely independent workload of 8 threads that we’ll call dispatch C (and color its threads blue). If we were to overlap it with dispatch A, we could essentially get it for “free” by utilizing the idle cores:


If you squint a bit and look at our GPU as if it were a CPU executing instructions instead of a GPU executing commands, then this kind of overlapping of work could be considered a kind of Instruction Level Parallelism. In this case the parallel operations are being explicitly specified in our command stream, making it somewhat similar to how VLIW architectures work.
Waits and Labels
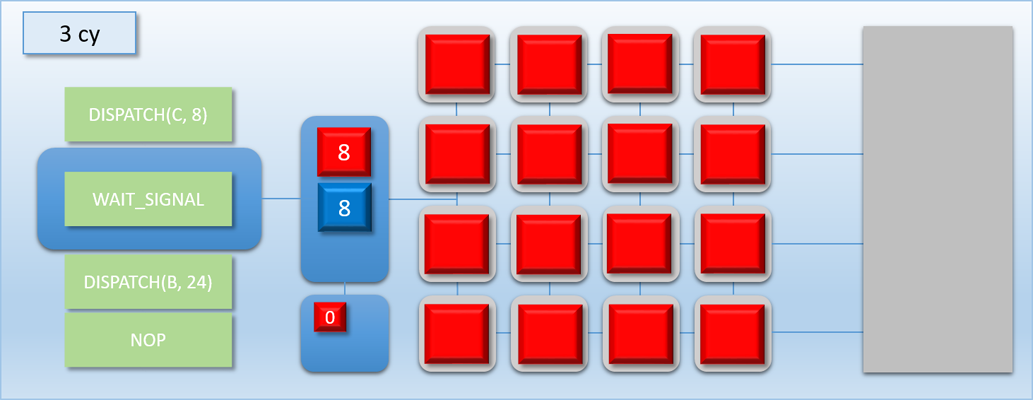
In the previous example, we were able to basically hide dispatch C in the idle time left by the barrier between dispatch A and dispatch B. But what if dispatch C was very complicated, and took much longer than 100 cycles to complete? Let’s re-do the example, except this time dispatch C will execute for 400 cycles instead of 100:


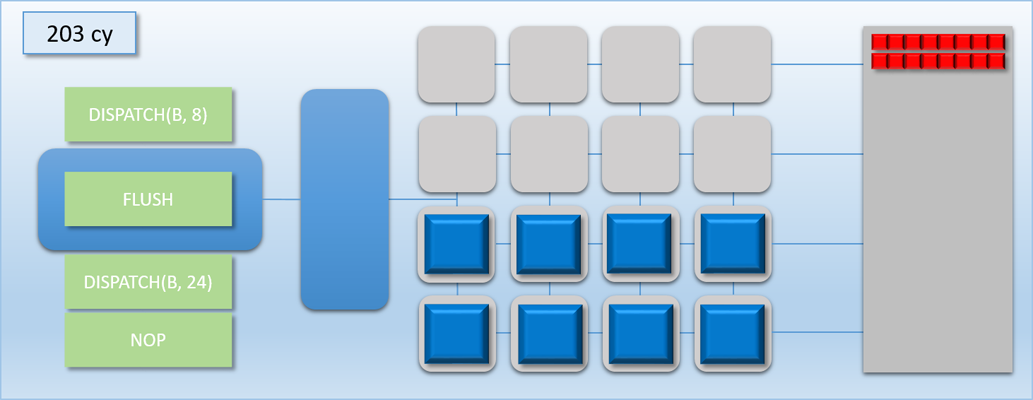

Things didn’t go as well this time around. We still got a bit of overlap between A and C, but that was immediately followed by 300 cycles where half of our shader cores were idle. This happened because our FLUSH command ends up waiting for dispatch C to finish, since the flush works by waiting for the thread queue to become completely empty. We could re-arrange things so that dispatch C gets kicked off after the flush, but this is not ideal either because there would still be a bit of idle time during the tail end of dispatch A, and also a long period of half-idle cores when dispatch C is running.
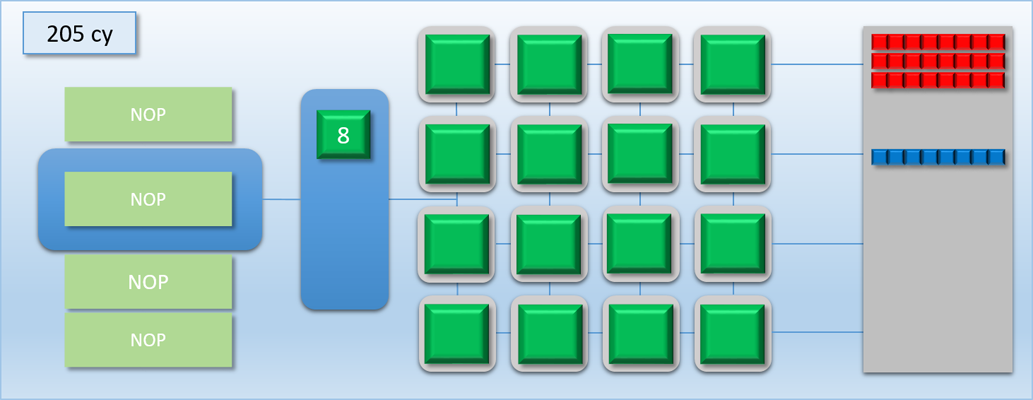
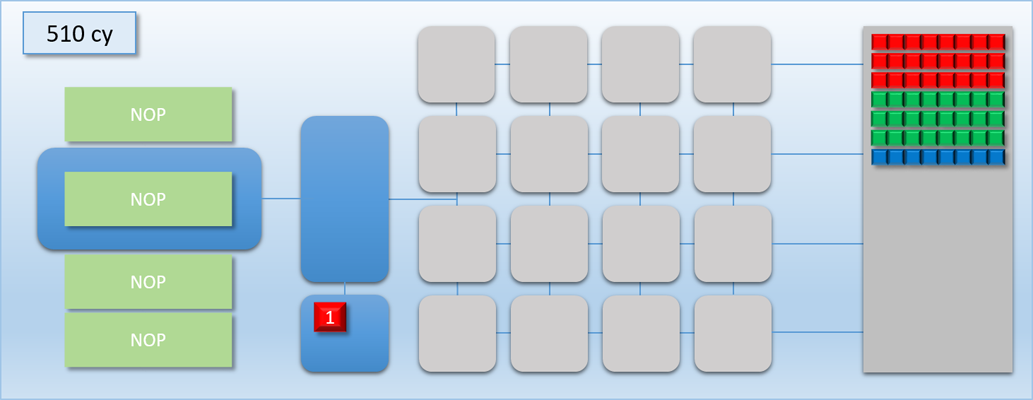
Lucky for us, there’s a new driver update for the MJP-3000 that should be able to help us out. MJP xPerience 3D Nocturnal™ Driver v5.444.198754 adds support for two new commands that can be parsed and executed by the command processor. The first one is called SIGNAL_POST_SHADER, and the other is called WAIT_SIGNAL. The first command is pretty fancy: it tells the command processor to write a signal value to an address in memory (often called a fence or label) once all shaders have completed. The cool part is that it’s a “deferred” write: the write is actually performed by the thread queue once it determines that all previously-queued threads have run to completion. This allows the command processor to move on to other commands while previous dispatches are still executing. The other command, WAIT_SIGNAL, tells the command processor to stall and wait for a memory address to be signaled. This can be used in conjunction with SIGNAL_POST_SHADER to wait for a particular dispatch to complete, but with the added bonus that the command processor can kick off more work in between those steps. To help visualize this process, let’s update the GPU diagram with a new component:
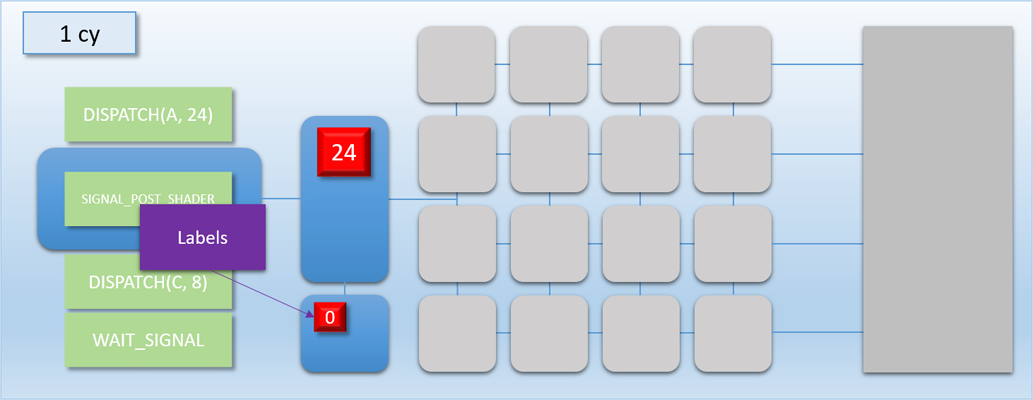
Once a SIGNAL_POST_SHADER command is executed, any pending labels will show up as a colored block in a new area under the thread queue. The number on the block shows the current status of the label: “0” means it hasn’t been signaled yet, and “1” means that it’s in the signaled state and any dependent waits will be released.
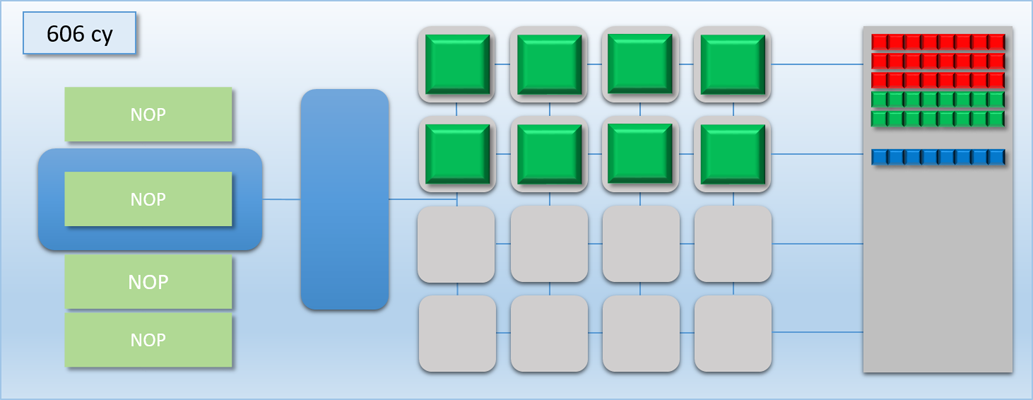
Let’s now try out our new commands with the previous example:

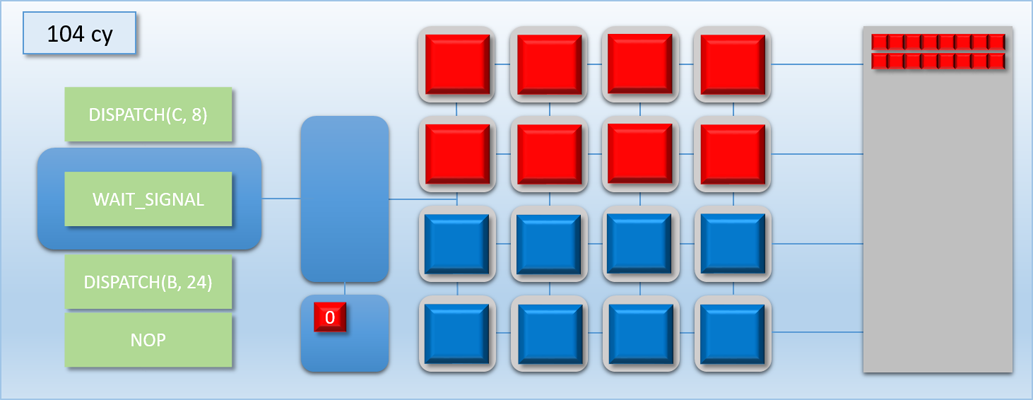
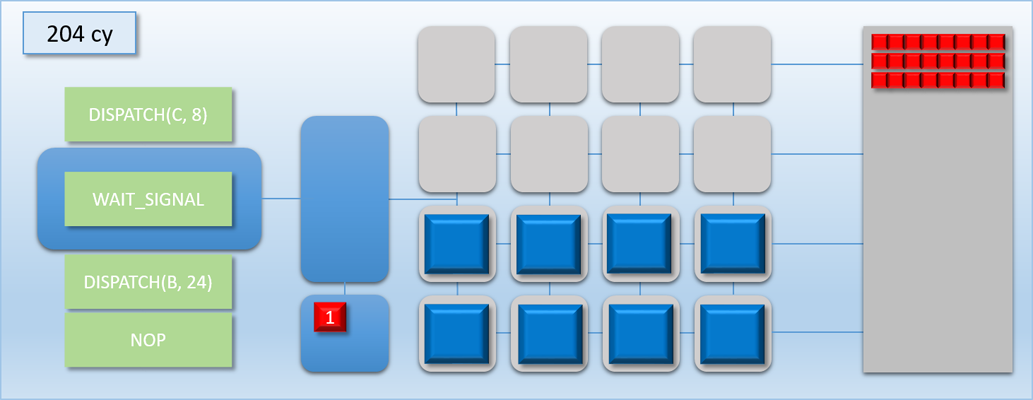

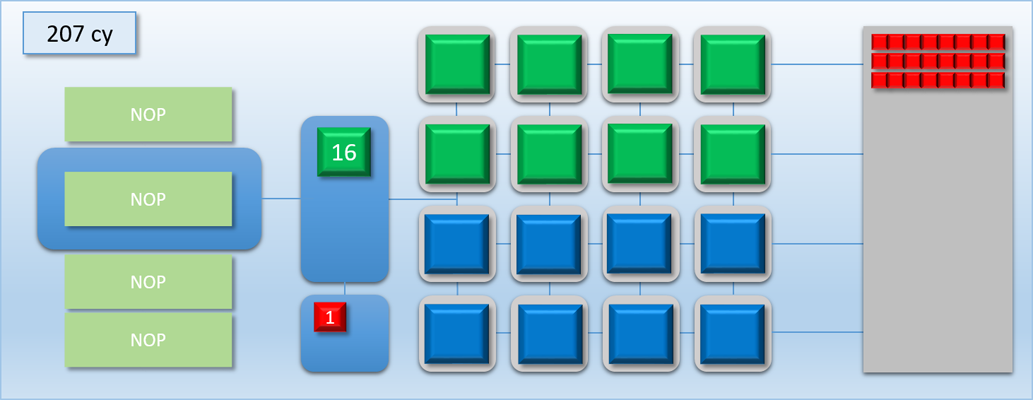
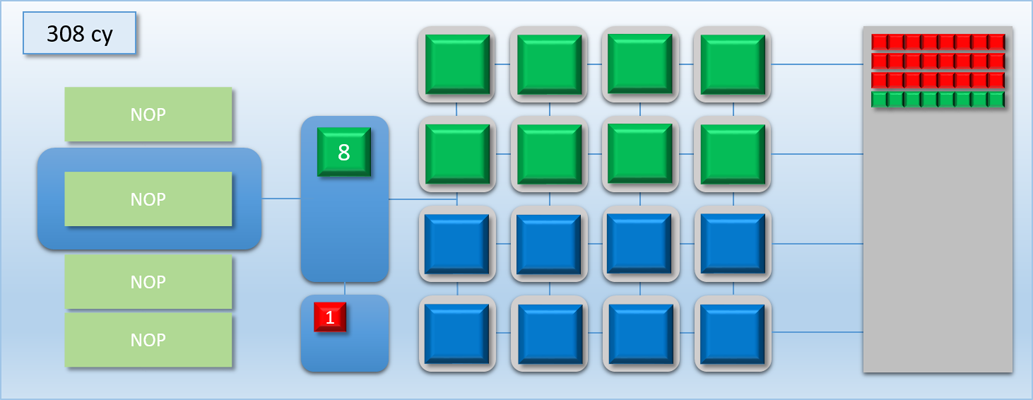
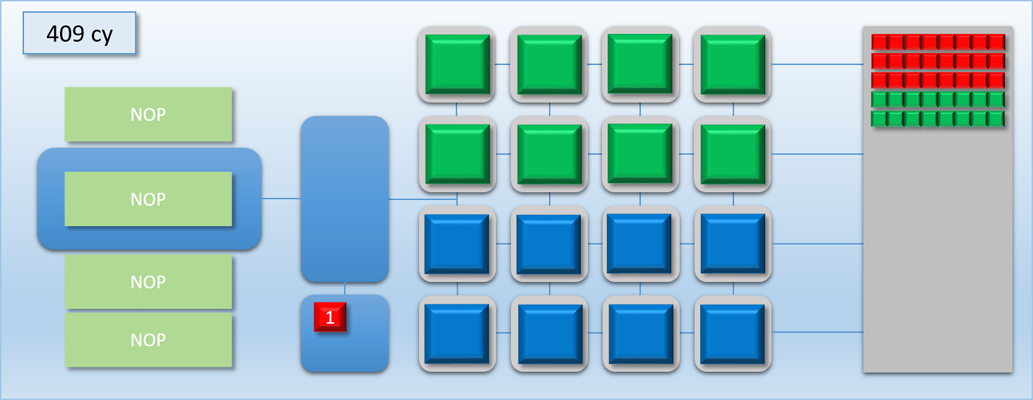
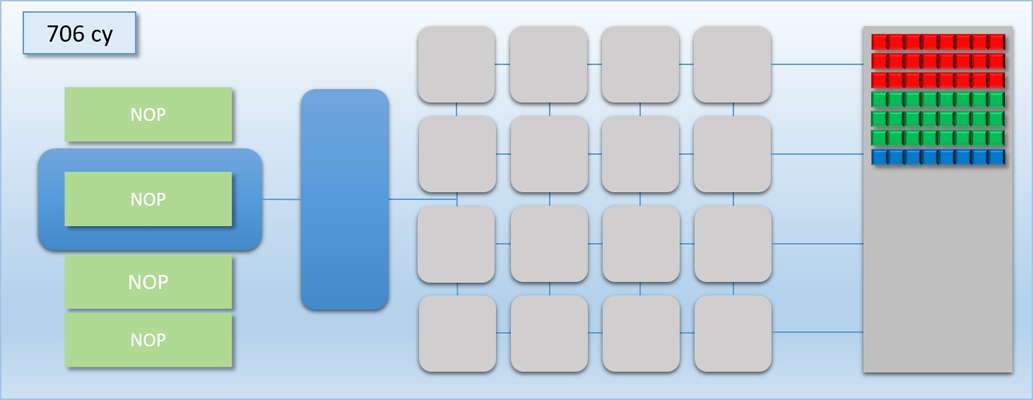
Very nice! By removing the long stall on dispatch C, we’ve effectively eliminated all of the idle time and kept the GPU busy for the entire duration of the 3 dispatches. As a result we’ve increased our overall throughput: previously the process took about 700 cycles, but now it’s down to about 500 cycles. Unfortunately this is still more time than it took to complete when we only had dispatch A and B to worry about, which means the latency for the A->B job increased by about 100 cycles. But at the same time the latency for dispatch C is is lower than it would be if it weren’t overlapped, since it would otherwise need to wait for either A or B to finish before it could start processing.
If the MJP-3000 were being programmed via D3D12 or Vulkan, then this signal/wait behavior is probably what you would hope to see when issuing a split barrier (vkCmdSetEvent + vkCmdWaitEvents in Vulkan-ese). Split barriers let you effectively specify 2 different points in a resource’s lifetime: the point where you’re done using it in its current state (read, write, etc.), and the point where you actually need the resource to be in its new state. By doing this and issuing some work between the begin and end of the barrier, the driver (potentially) has enough information to know that it can overlap the in-between work while it’s waiting for the pre-barrier work to finish. So for the example I outlined above, the D3D12 commands might go something like this:
- Issue Dispatch A which writes to Buffer A
- Begin Transition Buffer A from writable -> readable
- Issue Dispatch C which writes to Buffer C
- End Transition Buffer A from writable -> readable
- Issue Dispatch B which writes to Buffer B
For real-world GPU’s the benefits of split barriers can possibly be even greater than the sync point removal that I demonstrated with my imaginary GPU. As I mentioned in part 1, barriers on GPU’s are also responsible for handing things like cache flushes and decompression steps. These things increase the relative cost of a barrier past the simple “idle shader core tax” that we saw on our imaginary GPU, which gives us even more incentive to try to overlap the barrier with with some non-dependent work. However, the ability to overlap barrier operations with Draws and Dispatches is totally dependent on the specifics of the GPU architecture.
Before we wrap up, I’d like to point out that our GPU is still rather limited in terms of how it can overlap different dispatches, even with the new label/wait functionality that we just added. You can only do so much when the command processor is completely tied up every time that you need to wait for a previous dispatch to finish, which really starts to hurt you if you have more complex dependency chains. Later on in part 3 we’ll revisit this topic, and look at at how some hardware changes can help us get around these limitations.
Next Up
In Part 3, I’m going to discuss why explicit API’s expose multiple queues for submitting command buffers. I’ll also show how multiple queues could work on the fictional GPU architecture we’ve been using as an example, and discuss some implementations in real-world GPU’s.
Comments:
IRYOKU -
This was an amazing article, thanks for sharing!
#### [Baggers]( "techsnuffle@gmail.com") -
Once again awesome articles, I can tell I’m going to be referring to these for years :) A few tiny niggles - missing link between two shader cores. Row 1 column 3 (0 indexed) - “group of treads” in first paragraph after first mjp-3000 diagram - “dispatch B might read from dispatch B’s output buffer before the threads of dispatch A have finished!” should that be “might read from dispatch A’s output”?
#### [MJP](http://mynameismjp.wordpress.com/ "mpettineo@gmail.com") -
Thank you for the kind words, and for pointing out those issues! I’ve fixed the two typos, and I’ll fix the image one I’m on my home PC.
#### [MJP](http://mynameismjp.wordpress.com/ "mpettineo@gmail.com") -
Most GPU’s will actually have multiple threads “sharing” a shader core. The hardware scheduler will cycle through those threads at a relatively fast rate compared to CPU’s, which allows the hardware to hide the latency of memory operations. The basic idea is that if one thread stalls waiting for memory, the hardware can switch to another thread that can (hopefully) get some work done. The main difference from CPU’s is that there’s usually a finite limit of how many threads can be committed to a shader core, which is commonly referred to as “occupancy”. When a CPU switches threads, the current context is saved off to memory, which is usually backed by a very generous cache hierarchy. GPU threads however have *tons* of registers that live in very large register files, and very small caches. This usually makes it impractical to save off those registers to memory for a context switch, especially at the rate at which GPU’s switch threads. So instead most GPU’s will statically partition a core’s register file among all threads currently running on that core, with the number of registers being dependent on the complexity of the shader program being run. So if the core has 256 registers and the program needs 64 registers, then you can have a max 4 of threads committed to a core at any given time. This is why shader authors often try to optimize for register usage, since less registers means higher occupancy and more ability for the hardware to hide latency. This is a good slide deck that covers some of these details: http://bps10.idav.ucdavis.edu/talks/03-fatahalian_gpuArchTeraflop_BPS_SIGGRAPH2010.pdf It also talks about how GPU’s actually use SIMD for their shader cores, which is something that I left out of my made-up GPU in order to keep things simpler. But the fact that GPU threads are always executed on SIMD units in groups of 32 or 64 also has a bearing on register usage and occupancy, since it effectively means that your register count can actually be 32x or 64x larger! So for instance if you take AMD’s GCN architecture, each CU on the GPU has 4 SIMD units, and each SIMD has a register file with 256 registers. AMD works with “wavefronts” of 64 threads, which means that each SIMD has 64x256 32-bit registers (64KB). If you take the PS4’s GPU with 18 CU’s, that adds up to 4.5 MB of registers!
#### [Rim]( "remigius@netforge.nl") -
Another very nice read indeed. I recently followed a course on the computational complexity of scheduling algorithms and this got me wondering, isn’t optimizing your command submission and locking schedule really difficult (as in NP-hard) for anything but trivial scenarios? There’ll probably be heuristics that are good enough in practice, but I’m curious what you think, if you care to comment of course.
#### [nikitablack](http://nikitablack.github.io/ "nikita_chernyi@mail.ru") -
The article is amazing. Thank you for sharing the knowledge in accessible manner. You told that in your amazing MJP-3000 GPU you have 16 cores and hence 16 threads. Does that holds for real-world GPUs that one core can spawn only one thread (on PC we can span infinite number of threads even on a single core).
#### [Breaking Down Barriers – Part 3: Multiple Command Processors – The Danger Zone](https://mynameismjp.wordpress.com/2018/06/17/breaking-down-barriers-part-3-multiple-command-processors/ "") -
[…] 1 – What’s a Barrier? Part 2 – Synchronizing GPU Threads Part 3 – Multiple Command Processors Part 4 – GPU Preemption Part 5 – Back To The […]
#### [Breaking Down Barriers – Part 1: What’s a Barrier? – The Danger Zone](https://mynameismjp.wordpress.com/2018/03/06/breaking-down-barriers-part-1-whats-a-barrier/ "") -
[…] 1 – What’s a Barrier? Part 2 – Synchronizing GPU Threads Part 3 – Multiple Command Processors Part 4 – GPU Preemption Part 5 – Back To The […]