Breaking Down Barriers - Part 1: What's a Barrier?
This is Part 1 of a series about GPU synchronization and preemption. You can find the other articles here:
Part 1 - What’s a Barrier?
Part 2 - Synchronizing GPU Threads
Part 3 - Multiple Command Processors
Part 4 - GPU Preemption
Part 5 - Back To The Real World
Part 6 - Experimenting With Overlap and Preemption
If you’ve done any amount of D3D12 or Vulkan programming, then you’ve probably spent a good bit of that time grappling with barriers. They can be pretty tricky to get right: the validation layers seem to be always pointing out new issues whenever you change some rendering code, or when a new version of the validation layer comes in through Windows Update. And on top of that the IHV’s keep telling you that you need to be really careful and how you use barriers if you want GPU performance to meet or exceed what you get from D3D11, which is an additional challenge on top of simply achieving artifact-free results.
So what gives? Why the heck do we even need barriers in the first place, and why do things go so wrong if we misuse them? If you’ve done significant console programming or are already familiar with the lower-level details of modern GPU’s, then you probably know the answer to these questions, in which case this article isn’t really for you. But if you don’t have the benefit of that experience, then I’m going to do my best to give you a better understanding of what’s going on behind the scenes when you issue a barrier.
A High Barrier To Entry
Like almost everything else in programming and computers, the term “barrier” is already a bit overloaded. In some contexts, a “barrier” is a synchronization point where a bunch of threads all have to stop once they reach a particular point in the code that they’re running. In this case you can think of the barrier as an immovable wall: the threads are all running, but stop dead in their tracks when they “hit” the barrier:
void ThreadFunction()
{
    DoStuff();

    // Wait for all threads to hit the barrier
    barrier.Wait();

    // We now know that all threads called DoStuff()
}
This sort of thing is helpful when you want to know when a bunch of threads have all finished executing their tasks (the “join” in the fork-join model), or when you have threads that need to read other’s results. As a programmer you can implement a thread barrier by “spinning” (looping until a conditions met) on a variable updated via atomic operations, or by using semaphores and condition variables when you want your threads to go to sleep while they’re waiting.
In other contexts the term “barrier” will refer to a memory barrier (also known as a “fence”), particularly if you’ve somehow fallen down the rabbit hole of lock-free programming. In these scenarios you’re usually dealing with reordering of memory operations that’s done by the compiler and/or the processor itself, which can really throw a wrench in the works when you have multiple processors communicating through shared memory. Memory barriers help you out by letting you force memory operations to complete either before or after the barrier , effectively keeping them on one “side” of the fence. In C++ you can insert these into your code using platform-specific macros like MemoryBarrier in the Windows API, or through the cross-platform std::atomic_thread_fence. A common use case might look like this:
    // DataIsReady and Data are written to
    // by a different thread
    if(DataIsReady)
    {
    // Make sure that reading Data happens
    // *after* reading from DataIsReady
    MemoryBarrier();

    DoSomething(Data);
}
These two meanings of the term “barrier” have different specifics, but they also have something in common: they’re mostly used when one thing is producing a result and another thing needs to read that result. Another way of saying that is that one task has a dependency on a different task. Dependencies happen all of the time when writing code: you might have one line of code that adds two numbers to compute an offset, and the very next line of code will use that offset to read from an array. However you often don’t need to really be aware of this, because the compiler can track those dependencies for you and make sure that it produces code to give you the right results. Manually inserting barriers usually doesn’t come in until you do things in a way that the compiler can’t see how the data is going to be written to and read from at compile-time. This commonly happens due to multiple threads accessing the same data, but it can also happen in other weird cases (like when another piece of hardware writes to memory). Either way, using the appropriate barrier will make sure that the results will be visible to dependent steps, ensuring that they don’t end up reading the wrong data.
Since compilers can’t handle dependencies for you automatically when you’re doing multithreaded CPU programming, you’ll often spend a lot of time figuring how to express and resolve dependencies between your multithreaded tasks. In these situations it’s common to build a dependency graph indicating which tasks depend on the results of other tasks. That graph can help you decide what order to execute your tasks, and when you need to stick a sync point (barrier) between two tasks (or groups of tasks) so that the earlier task completely finishes before the second task starts executing. You’ll often see these graphs drawn out as a tree-like diagram, like in this easy-to-understand example from Intel’s documentation for Thread Building Blocks:
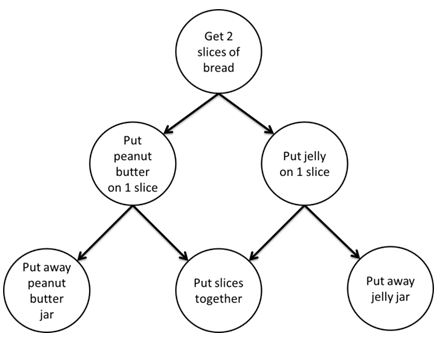
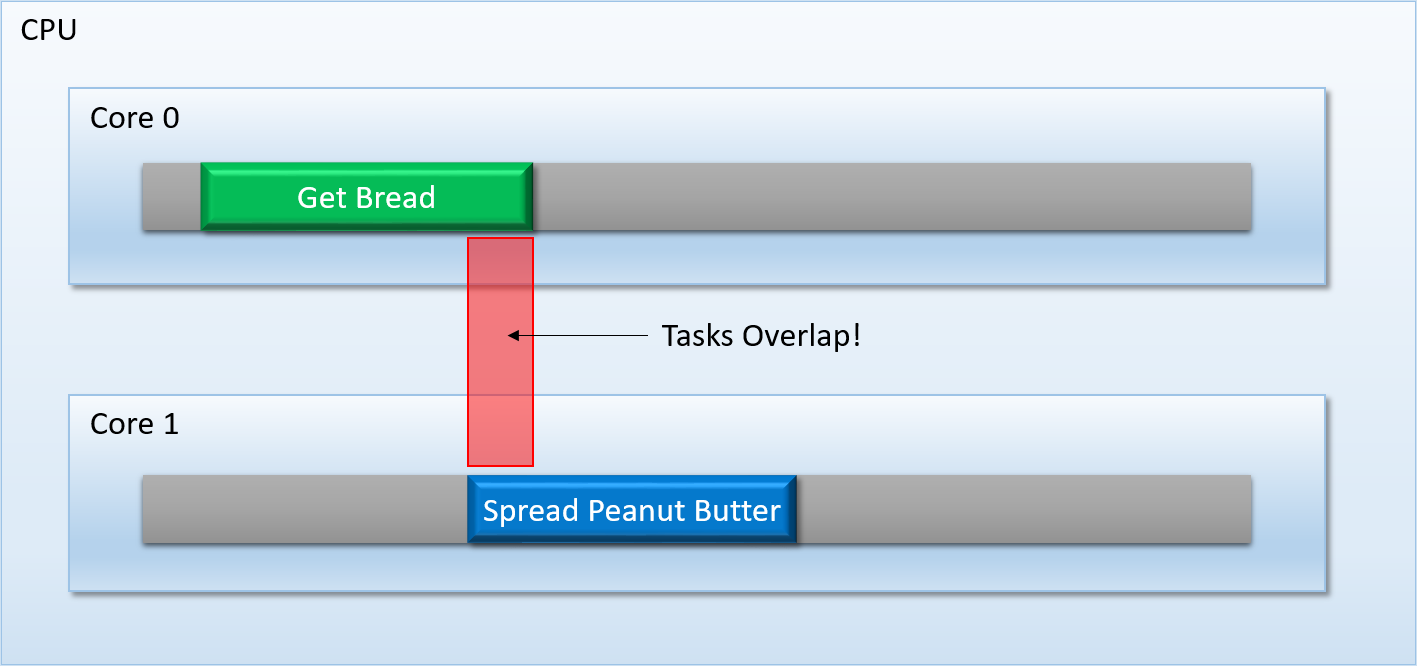
Even if you’ve never done task-oriented multithreaded programming, this diagram makes the concept of dependencies pretty clear: you can’t put the peanut better on the bread before you’ve gotten the bread! At a high level this determines the order of your tasks (bread before peanut butter), but it also subtly implies something that would be obvious to you if you were doing this in real life: you can’t start applying your peanut butter until you’ve gotten out your slices of bread from the cabinet. If you were doing this in real life by yourself, you wouldn’t even think about this. There’s only 1 of you, so you would just go through each step one at a time. But we were originally discussing this in the context of multithreading, which means that we’re talking about trying to run different tasks on different cores in parallel. Without properly waiting you could end up with the peanut butter task running at the same time as the bread step, and that’s obviously not good!
To avoid these kinds of issues, task schedulers like TBB give you mechanisms that force a task (or group of tasks) to wait until a prior task (or group of tasks) completely finishes executing. Like I mentioned earlier, you could call this mechanism a barrier, or a sync point:
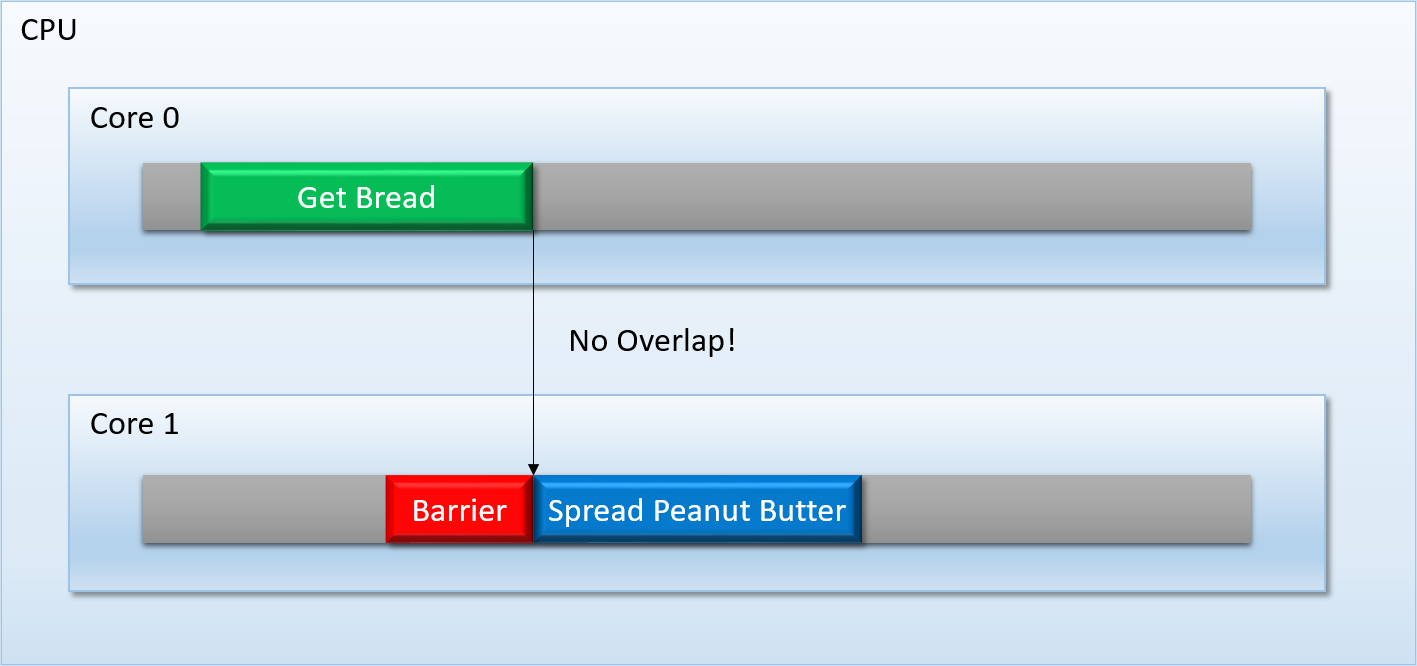
This sort of thing is pretty easy to implement on modern PC CPU’s, since you have a lot of flexibility as well as some powerful tools at your disposal: atomic operations, synchronization primitives, OS-supplied condition variables, and so on.
Back To GPU Land
So we’ve covered the basics of what a barrier is, but I still haven’t explained why we have them in API’s designed for talking to the GPU. After all, issuing Draw and Dispatch calls isn’t really the same as scheduling a bunch of parallel tasks to execute on separate cores, right? I mean, if you look at a D3D11 program’s sequence of API calls it looks pretty damn serial:
If you’re used to dealing with GPU’s through an API like this, you’d be forgiven for thinking that the GPU just goes through each command one at a time, in the order you submit them. And while this may have been true a long time ago, the reality is actually quite a bit more complicated on modern GPU’s. To show you what I’m talking about, let’s take a look at what my Deferred Texturing sample looks like when I take a capture with AMD’s awesome profiling tool, Radeon GPU Profiler:
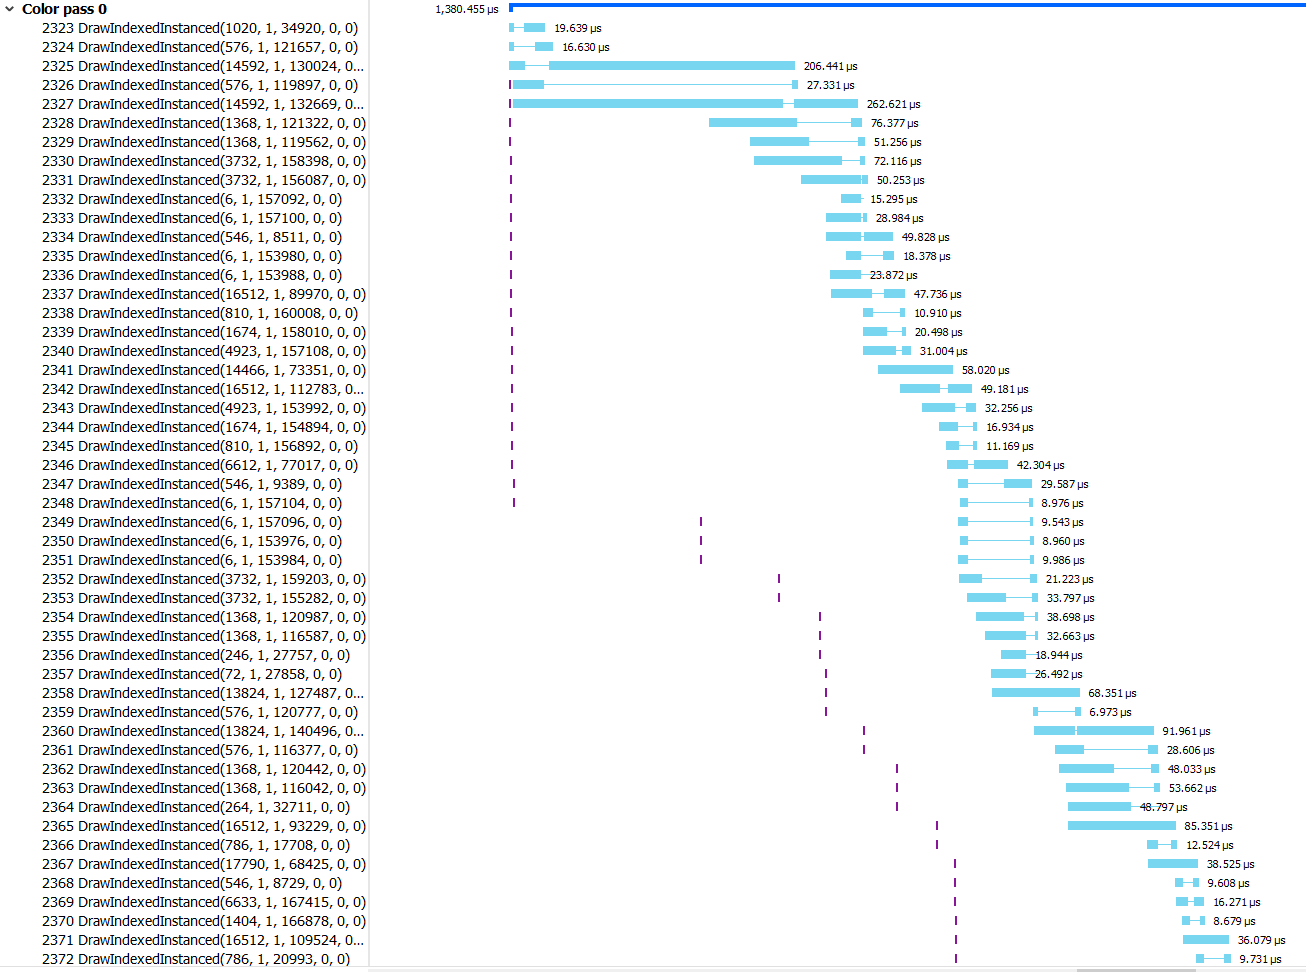
This snippet is showing just a portion of a frame, specifically the part where all of the scene geometry is rasterized into the G-Buffer. The left-hand side shows the draw call, while the blue bars to the right show when the draw call actually starts and stops executing. And what do you know, there’s a whole lot of overlapping going on there! You can see the same thing shown a bit differently if you fire up PIX for Windows:
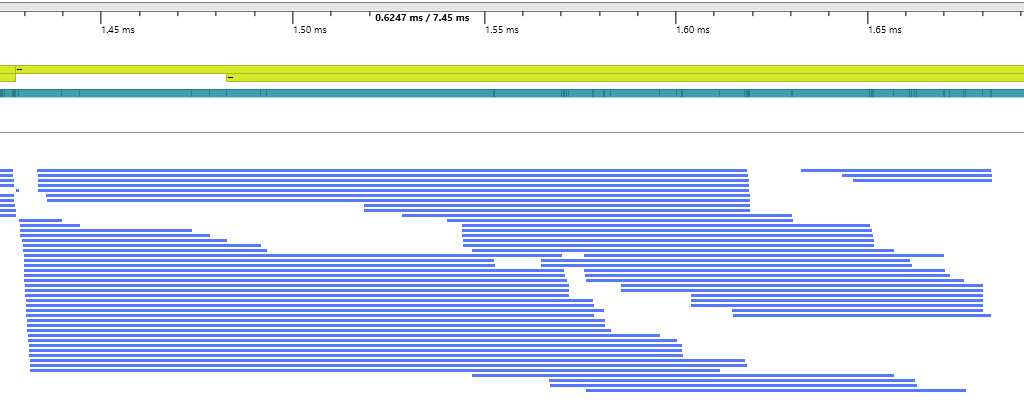
This is a snippet from PIX’s timeline view, which is also showing the execution time for the same sequence of draw calls (this time captured on my GTX 1070, whereas the earlier RGP capture was done on my significantly less beefy RX 460). You can see the same pattern: the draws start executing roughly in submission order, but they overlap all over the place. In some cases, draws will start and finish before an earlier draw completes!
If you know even a little bit about GPU’s this shouldn’t be completely surprising. After all, everyone knows that a GPU is mostly made up of hundreds or thousands of what the IHV’s like to call “shader cores”, and those shader cores all work together to solve “embarrassingly parallel” problems. These days the bulk of work done to process a draw (and pretty much all of the work done to process a dispatch) is performed on these guys, which run the shader programs compiled from our HLSL/GLSL/MetalSL code. Surely it makes sense to have the shader cores process the several thousand vertices from a single draw call in parallel, and to do the same with the thousands or millions of pixels that result from rasterizing the triangles. But does it really make sense to let multiple draw calls or dispatches bleed over into one another so that your actual high-level commands are also executing in parallel?
The correct answer is, “yes, absolutely!” In fact, hardware designers have put in quite a bit of effort over the years to make sure that their GPU’s can do this even if there are some state changes in between the draws. Desktop GPU’s have even engineered their ROP’s (the units that are responsible for taking the output of a pixel shader and actually writing it to memory) so that they can resolve blending operations even if the pixel shaders didn’t finish in draw order! Doing it this way helps avoid having idle shader cores, which in turn gives you better throughput. Don’t worry if this doesn’t completely make sense right now, as I’m going to walk through some examples in a future post that explain why this is the case. But for now, just take my word for it that allowing draws and dispatches to overlap generally leads to higher throughput.
If a GPU’s threads from a draw/dispatch can overlap with other, that means that the GPU needs a way to prevent that from happening in cases where there’s a data dependency between two tasks. When this happens, it makes sense do what we do on a CPU, and insert something roughly similar to a thread barrier in order to let us know when a group of threads have all finished their work. In practice GPU’s tend to do this in a very coarse manner, such as waiting for all outstanding compute shader threads to finish before starting up the next dispatch. This can be called a “flush”, or a “wait for idle”, since the GPU will wait for all threads to “drain” before moving on. But we’ll get into that in more detail in the next article.
Caches are Hard
Hopefully by now it’s clear that there’s at least one reason for barriers on GPU’s: to keep shader threads from overlapping when there’s a data dependency. This is really the same scenario with the peanut butter and the bread that we laid out earlier when talking about CPU threads, except with the core count cranked up to the thousands. But unfortunately things get a bit more complicated when we’re talking about GPU’s as opposed to CPU’s.
Let’s say that you start up a group of threads running on a PC CPU that write a bunch of data to individual buffers, insert a thread barrier to wait until those threads are finished, and then kick off a second group of threads that reads the output data of the first group of threads. As long as you make sure that you have the right memory/compiler barriers in place to ensure that the second tasks’s read operations don’t happen too early (and often you get this by default from using OS synchronization primitives or atomic operations), you don’t need to care about getting correct results in the presence of a cache hierarchy. This is because the caches on an x86 core (usually each core has its own individual L1 cache, with a shared L2 and possibly L3 cache) are coherent, which means that they stay “up to date” with each other as they access different memory addresses. The details of how they achieve this miraculous feat are quite complicated, but as programmers we’re usually allowed to remain blissfully ignorant of the internal gymnastics being performed by the hardware.
Things are not so simple for the poor folks that write drivers for a GPU. For various reasons, some of them dating back to their legacy as devices that weren’t used for general-purpose computing like they are now, GPU’s tend to have a bunch of caches that aren’t always organized into a strict hierarchy. The details aren’t always public, but AMD tends to have quite a bit of public information available about their GPU’s that we can learn from. Here’s a diagram from slide 50 of this presentation:
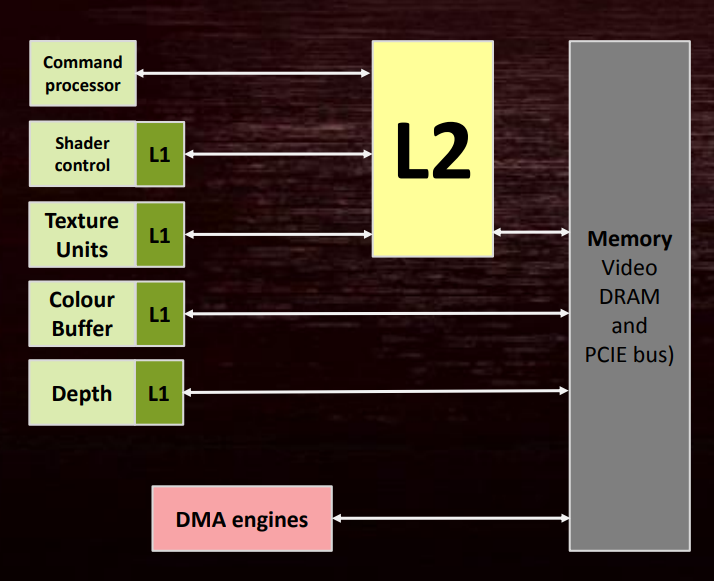
This looks quite different from a CPU’s cache hiearchy! We have two things with L1 that go through L2 the way that you expect they would, but then there’s color and depth caches that bypass L2 and go right to memory! And there’s a DMA engine that doesn’t go through cache at all! The diagram here is also a bit misleading, since in reality there’s an L1 texture cache on every compute unit (CU), and there can be dozens of compute units on the larger video cards. There’s also multiple instruction caches and scalar data L1’s, with one of these shared between up to 4 CU’s. There’s lots of details in this GCN whitepaper, which explains how the various caches work, and also how direct memory writes from shaders (AKA writes to UAV’s) go through their local L1 and eventually propagate to L2.
As a consequence of having all of these caches without a strict hierarchy, the caches can sometimes get out of sync with each other. As the GCN whitepaper describes, the L1 caches on the shader units aren’t coherent with each other until the writes reach L2. This means that if one dispatch writes to a buffer and another reads from it, the CU L1 cache may need to be flushed in between those dispatches to make sure that all of the writes at least made it to L2 (a cache flush refers to the operation of taking modified/dirty cache lines and writing them out to the next cache level, or actual memory if applied to the last cache level). And as slide 52 describes, it’s even worse when a texture goes from being used as a render target to being used as a readable texture. For that case the writes to the render target could be sitting in the color buffer L1 cache that’s attached to the ROP’s, which means that cache has to be flushed in addition to flushing the other L1’s and L2 cache. (note that AMD’s new Vega architecture has more unified cache hierarchy where the ROP’s are also clients of the L2).
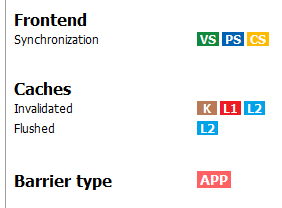
One cool thing about AMD hardware is that their tools actually show you when this happens! Here’s a snippet from an RGP capture showing the caches being flushed (and shader threads being synchronized!) on my RX 460 after large dispatch finishes writing to a texture:
Now the point of this isn’t just to explain how caches are hard and complicated, but to illustrate another way in which GPU’s require barriers. Ensuring that your threads don’t overlap isn’t sufficient for resolving read-after-write dependencies when you also have multiple caches that can have stale data in them. You’ve also got to invalidate or flush those caches to make the results visible to subsequent tasks that need to read the data.
Squeezing Out More Bandwidth
GPU’s have gotten more and more focused on compute as time goes on, but they’re still heavily optimized for rasterizing triangles into a grid of pixels. Doing this job means that the ROP’s can end up having touch a ton of memory every frame. Games now have to render at up to 4k resolutions, which works out to 8294400 pixels if you write every one with no overdraw. Multiply that by 8 bytes per-pixel for 16-bit floating point texture formats, or maybe up to 30 or 40 bytes per-pixel for fat G-Buffers, and you’re looking at a lot bandwidth consumption just to touch all of that memory once (and typically many texels will be touched more than once)! It only gets worse if you add MSAA into the mix, which will double or quadruple the memory and bandwidth requirements in the naive case.
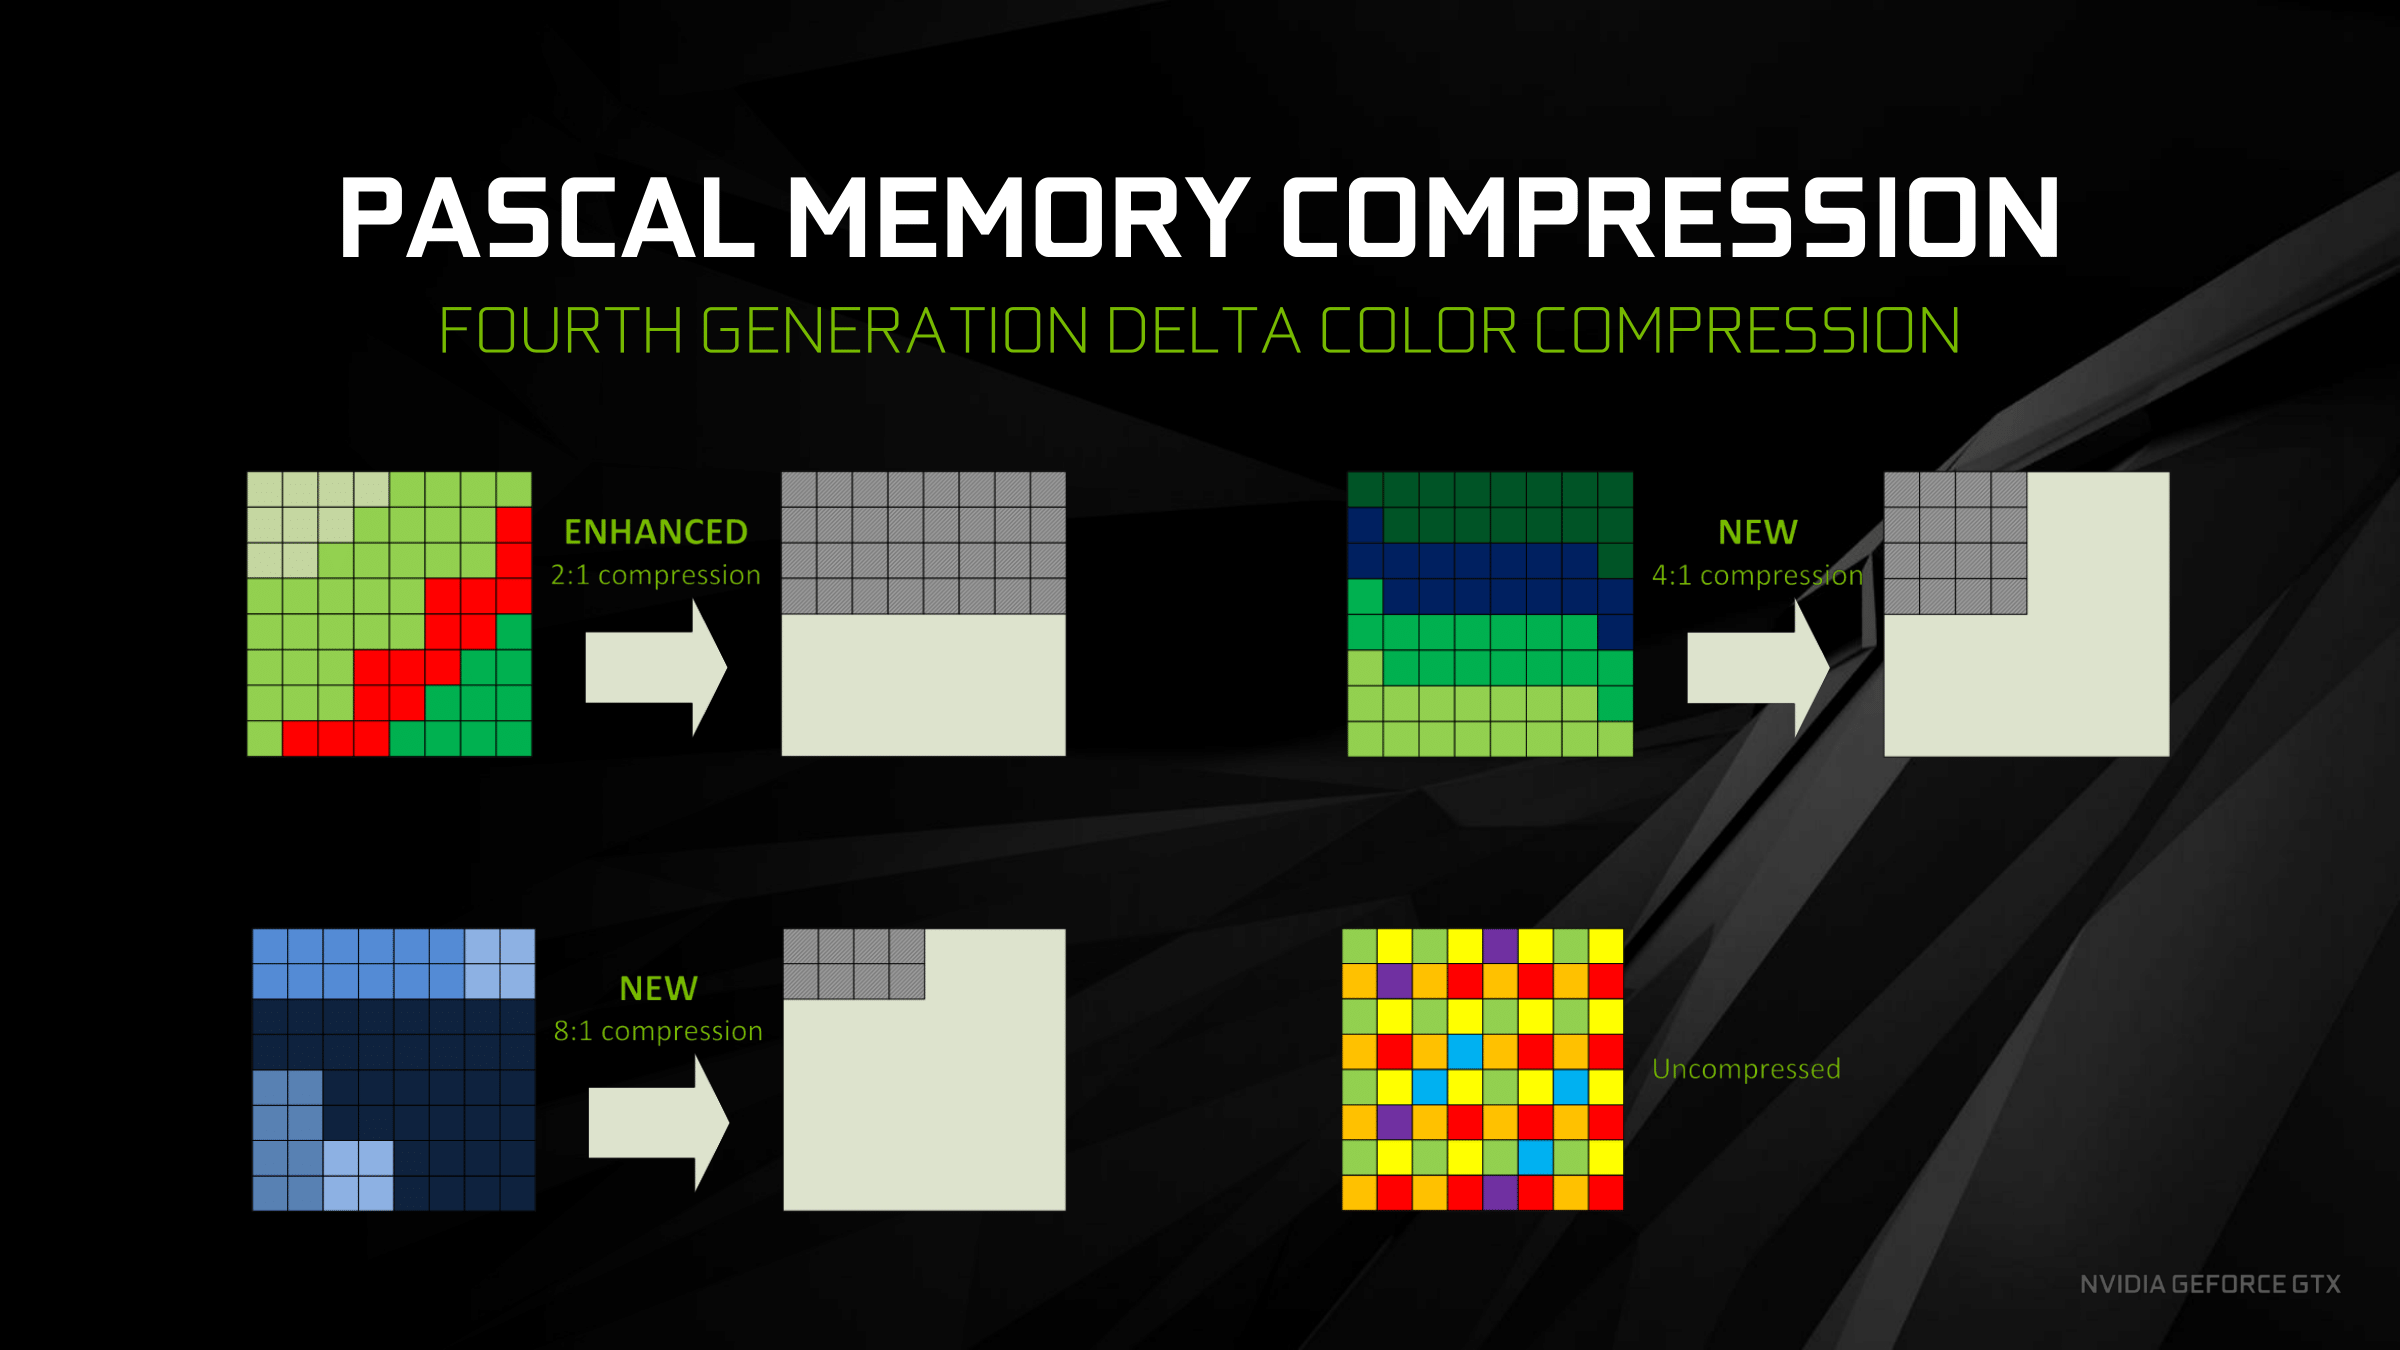
To help keep that bandwidth usage from becoming a bottleneck, GPU designers have put quite a bit of effort into building lossless compression techniques into their hardware. Typically this sort of thing is implemented as part of the ROP’s, and is therefore used when writing to render targets and depth buffers. There’s been a lot of specific techniques used over the years, and the exact details haven’t been made available to the public. However AMD and Nvidia have provided at least a bit of information about their particular implementations of delta color compression in their latest architectures. The basic gist of both techniques is that they aim to exploit the similarity in neighboring pixels in order to avoid storing a unique value for every texel of the render target. Instead, the hardware recognizes patterns in blocks of pixels, and stores each pixel’s difference (or delta) from an anchor value. Nvidia’s block modes give them anywhere from 2:1 to 8:1 compression ratios, which potentially results in huge bandwidth savings!
So what exactly does this have to do with barriers? The problem with these fancy compression modes is that while the ROP’s may understand how to deal with the compressed data, the same is not necessarily true when shaders need to randomly-access the data through their texture units. This means that depending on the hardware and how the texture is used, a decompression step might be necessary before the texture contents are readable by a dependent task (or writable through a means other than ROP’s). Once again, this is something that falls under the umbrella of “barriers” when we’re talking about GPU’s and the new explicit API’s for talking to them.
But What About D3D?
After reading through my ramblings about thread synchronization, cache coherency, and GPU compression, you hopefully have at least a very basic grasp of 3 potential reasons that typical GPU’s require barriers to do normal things that we expect of them. But if you look at the actual barrier API’s in D3D12 or Vulkan, you’ll probably notice that they don’t really seem to directly correspond with what we just talked about. After all, it’s not like there’s a “WaitForDispatchedThreadsToFinish” or “FlushTextureCaches” function on ID3D12GraphicsCommandList. And if you think about it, it makes sense that they don’t do this. The fact that most GPU’s have lots of shader cores where tasks can overlap is a pretty specific implementation detail, and you could say the same about GPU’s that have weird incoherent cache hierarchies. Even for an explicit API like D3D12 it wouldn’t make sense to leak that kind of detail across its abstraction, since it’s totally possible that one day D3D12 could be used to talk to a GPU that doesn’t behave the way that I just described (it may have already happened!).
When you think of things from that perspective, it starts to make sense that D3D12/Vulkan barriers are more high-level, and instead are mostly aimed at describing the flow of data from one pipeline stage to another. Another way to describe them is to say that the barriers tell the driver about changes in the visibility of data with regards to various tasks and/or functional units, which as we pointed out earlier is really the essence of barriers. So in D3D12 you don’t say “make sure that this draw call finishes before this other dispatch reads it”, you say “this texture is transitioning from a ‘render target’ state to a ‘shader readable’ state so that a shader program can read from it”. Essentially you’re giving the driver a bit of information about the past and future life of a resource, which may be necessary for making decisions about which caches to flush and whether or not to decompress a texture. Thread synchronization is then implied by the state transition rather than explicit dependencies between draws or dispatches, which isn’t a perfect system but it gets the job done.
If you’re wondering why we didn’t need to manually issue barriers in D3D11, the answer to that question is “because the driver did it for us!”. Remember how earlier I said that a compiler can analyze your code to determine dependencies, and generate the appropriate assembly automatically? This is basically what drivers do in D3D11, except they’re doing it at runtime! The driver needs to look at all the resources that you bind as inputs and outputs, figure out when there’s visibility changes (for instance, going from a render target to a shader input), and insert the necessary sync points, cache flushes, and decompression steps. While it’s nice that you automatically get correct results, it’s also bad for a few reasons:
- Automatically tracking resources and draw/dispatch calls is expensive, which is not great when you want to squeeze your rendering code into a few milliseconds per frame.
- It’s really bad for generating command buffers in parallel. If you can set a texture as a render target in one thread and then bind it as an input in another thread, the driver can’t figure out the full resource lifetime without somehow serializing the results of the two threads.
- It relies on an explicit resource binding model, where the context always knows the full set of inputs and outputs for every draw or dispatch. This can prevent you from doing awesome things with bindless resource access.
- In some cases the driver might issue unnecessary barriers due to not having knowledge of how the shaders access their data. For example, two dispatches that increment the same atomic counter won’t necessarily need a barrier between them, even though they access the same resource.
The thinking behind D3D12 and Vulkan is that you can eliminate those disadvantages by having the app provide the driver with the necessary visibility changes. This keeps the driver simpler, and lets the app figure out the barriers in any manner that it wants. If your rendering setup is fairly fixed, you can just hard-code your barriers and have essentially 0 CPU cost. Or you can setup your engine to build its own dependency graph, and use that to determine which barriers you’ll need.
Next Up
In the next article, I’m going to dive a bit deeper into the topic of thread-level synchronization and how it’s typically implemented on GPU’s. Stay tuned!
Comments:
Rim -
Things sure changed since the good ol’ XNA days :) Looks like a very interesting read, thanks for the write-up!
#### [Baggers]( "techsnuffle@gmail.com") -
Fantastic writeup, thanks for making these
#### [Breaking Down Barriers – Part 2: Synchronizing GPU Threads – The Danger Zone](https://mynameismjp.wordpress.com/2018/04/01/breaking-down-barriers-part-2-synchronizing-gpu-threads/ "") -
[…] to part 2 of the series! In the previous article, I explained the basics of what a barrier is, and talked about the various reasons for why you need […]
#### [Breaking Down Barriers – Part 3: Multiple Command Processors – The Danger Zone](https://mynameismjp.wordpress.com/2018/06/17/breaking-down-barriers-part-3-multiple-command-processors/ "") -
[…] Part 1 – What’s a Barrier? Part 2 – Synchronizing GPU Threads Part 3 – Multiple Command Processors Part 4 – GPU Preemption Part 5 – Back To The Real World Part 6 – Experimenting With Overlap and Preemption […]
#### []( "") -
This is so nice. I am learning a lot from your articles :-)