Shader Printf in HLSL and DX12
Unless you’re fortunate enough to to be working exclusively in Cuda, debugging GPU shaders is still very much “not great” in the year 2024. Tools like RenderDoc and PIX are amazing and do provide the ability to step through a shader and inspect variables, but they’re fundamentally tied to a “capture” workflow. This means that you need to run your game or app from RenderDoc/PIX in capture mode (which adds overhead), and then capture at least a single frame. Then after the capture is finished you can analyze it, find your draw or dispatch, and finally select which thread you’d like to debug. Once you’re debugging things generally work, but it’s still possible you’ll encounter issues due to the way that debugging works in these tools. They are are not simply inspecting the state of an executing (suspended) thread like you would expect from a CPU debugger, instead they work by either emulating shader instructions on the CPU or by patching the shader bytecode to emit intermediate program state to a buffer that can be read by the CPU. Don’t get me wrong, these tools are great to have and it’s fantastic that they can be used to debug shaders at all. But it’s still not enough, and generally more debugging tools are needed for unusually tough problems. Even if vendor-agnostic GPU debuggers were as good as they are on CPU, you would still probably want to reach for some other tools depending on the situation.
In CPU land, the venerable printf and all of its related functions are commonly used for debugging and diagnostics. However we have not yet had a cross-vendor/cross-API way to do the same for shaders. To be fair it’s a lot more complicated on a GPU! Shaders run in batches of thousands or even millions of threads, and run on a completely separate processor than what the OS and all of its facilities run on. Despite those issues, Vulkan/SPIR-V does actually provide a printf that’s available from both GLSL and HLSL1. It comes with caveats though. In particular it’s setup so that the messages can be intercepted by a validation layer or by RenderDoc, which makes it more difficult for the engine/app itself to obtain the messages and process them. And of course this doesn’t help if you’re target D3D12 or other APIs and you’d like your prints to work on those platforms as well.
In this article I’ll walk through how to build your own shader printf completely in software, using HLSL and D3D12 as the target language and API. The concepts here can be adapted to any API and shader language, although the shading language and compile can (significantly) impact how you handle strings in your shaders,
Overall Approach
The printf implementation I’m going to describe is going to work like this:
- Every frame, have the GPU clear a big buffer that we’ll use to store the print strings and arguments
- Make a debug info buffer SRV available at a “magic” known descriptor index, which effectively makes it globally available to all shaders through a
#include- This buffer will have a descriptor index for the print buffer, along with some additional info useful for debugging
- When a shader wants to print, it will use an atomic to allocate some space in the big print buffer and stuff the string + data into it
- After recording every frame, copy the print buffer to a CPU-accessible readback buffer so that the data can be read back. Then every print can be decoded from the buffer and logged somewhere.
Pretty simple in concept! But as always the devil is in the details. Lets go though them one by one.
Setting Up The Print Buffer
For our print buffer we don’t need anything fancy at all, just a “big enough” buffer that’s writable by the GPU. In my sample framework I do it like this, and also create a pair of matching readback buffers:
PrintBuffer.Initialize({
    .NumElements = 1024 * 1024  * 4,
    .CreateUAV = true,
    .Name = L"Shader Debug Print Buffer",
});

for(ReadbackBuffer& buffer : PrintReadbackBuffers)
    buffer.Initialize(PrintBuffer.InternalBuffer.Size);
PrintBuffer in this case is a RawBuffer which ends up being a RWByteAddressBuffer in the shader. Every frame it gets cleared to all 0’s, which I do with a utility function that just uses a compute shader to do the clear (since ClearUnorderedAccessViewUINT is painful to use in D3D12):
DX12::ClearRawBuffer(cmdList, PrintBuffer, Uint4(0, 0, 0, 0));

DX12::Barrier(cmdList, PrintBuffer.InternalBuffer.WriteToWriteBarrier());
void ClearRawBuffer(ID3D12GraphicsCommandList* cmdList, const RawBuffer& buffer, const Uint4& clearValue)
{
    cmdList->SetComputeRootSignature(UniversalRootSignature);
    cmdList->SetPipelineState(clearRawBufferPSO);

    Assert_(buffer.UAV != uint32(-1));

    ClearRawBufferConstants cbData =
    {
        .ClearValue = clearValue,
        .DescriptorIdx = buffer.UAV,
        .Num16ByteElements = uint32(AlignTo(buffer.NumElements * buffer.Stride, 16) / 16),
    };
    BindTempConstantBuffer(cmdList, cbData, URS_ConstantBuffers + 0, CmdListMode::Compute);

    uint32 dispatchX = DispatchSize(cbData.Num16ByteElements, clearRawBufferTGSize);
    cmdList->Dispatch(dispatchX, 1, 1);
}
That’s it for the print buffer setup! Next we’ll look at our “magic” debug info buffer.
The “Magic” Debug Info Buffer
In my sample framework I use shader hot-reloading quite frequently, since it provides a super-quick iteration loop that doesn’t require re-starting the app. Often one of the reasons for hot-reloading a shader is to add some temporary debugging code in order to figure out why something isn’t working correctly. To that end, I wanted to have the ability to add debug prints to any shader without having to change the bindings and re-compile the C++ code. This could potentially be done by either always adding an extra descriptor index to binding structs or by ensuring it was always bound to the root signature, but instead I opted to lean on Shader Model 6.6 bindless by just placing a buffer SRV descriptor at a “known” static index shared between C++ and GPU code. That makes the buffer available to anyone regardless of what root signature they use or what else is going on in the shader, which is nice. On the C++ side it’s simple: I just added a way to allocate a specific descriptor index from my DescriptorHeap type, create an SRV in that descriptor slot, and free the original SRV descriptor:
DebugInfoBuffer.Initialize({
    .NumElements = sizeof(DebugInfo) / 4,
    .Dynamic = true,
    .CPUAccessible = true,
    .Name = L"Debug Info Buffer",
});

const PersistentDescriptorAlloc alloc = DX12::SRVDescriptorHeap.AllocatePersistent(MagicDebugBufferIndex);
DX12::SRVDescriptorHeap.FreePersistent(DebugInfoBuffer.SRV);
DebugInfoBuffer.SRV = alloc.Index;

for(uint32 i = 0; i < ArraySize_(alloc.Handles); ++i)
{
    const D3D12_SHADER_RESOURCE_VIEW_DESC srvDesc = DebugInfoBuffer.SRVDesc(i);
    DX12::Device->CreateShaderResourceView(DebugInfoBuffer.Resource(), &srvDesc, alloc.Handles[i]);
}
Then every CPU frame we just need to fill that buffer with fresh data:
DebugInfo debugInfo =
{
    .PrintBuffer = PrintBuffer.SRV,
    .PrintBufferSize = uint32(PrintBuffer.InternalBuffer.Size),
    .CursorXY = { cursorX, cursorY },
};
DebugInfoBuffer.MapAndSetData(&debugInfo, sizeof(debugInfo) / 4);
In the shader it’s no fuss at all to get the buffer through ResourceDescriptorHeap:
// In a header file shared between shaders and C++:
struct DebugInfo
{
    DescriptorIndex PrintBuffer;
    ShaderUint PrintBufferSize;
    ShaderUint2 CursorXY;
};

SharedConstant_ DescriptorIndex MagicDebugBufferIndex = 1024;
// In ShaderDebug.hlsli
DebugInfo GetDebugInfo()
{
    ByteAddressBuffer debugBuffer = ResourceDescriptorHeap[MagicDebugBufferIndex];
    return debugBuffer.Load<DebugInfo>(0);
}
In addition to the index of the print buffer descriptor, I have the mouse cursor position in there as well since that’s useful for “print data for the pixel under the cursor” scenarios. But you could add other things too: debug flags or floats that you can use in the shader without having to explicitly add new ones, frame indices or other program state, whatever you want.
Dealing With The String Problem
Now that we have access to our magic debug info buffer which then gives us access to our print buffer, we can start building up the functionality needed to write data into that buffer. This is where things unfortunately get rather dicey in HLSL, which has no native support for working with strings or even a char type. The SPIR-V printf kinda works around this, since you only pass a literal to a printf intrinsic and then the compiler handles the rest. But this does not help us at all if we need to do our own processing of the string, which we need to do for our home-grown printf implementation. One workaround I’ve used myself and seen used elsewhere is to declare uint arrays of character literals, and pass those around. This works nicely enough with existing language support, but it’s about as ugly as you’d imagine:
const uint printStr[] = { 'T', 'h', 'i', 's', ' ', 'i', 's', ' ', 'a', ' ',
                          't', 'e', 'r', 'r', 'i', 'b', 'l', 'e',
                          ' ', 'w', 'a', 'y', ' ', 't', 'o', ' ',
                          'w', 'r', 'i', 't', 'e', ' ', 'a',
                          ' ', 's', 't', 'r', 'i', 'n', 'g', };
DebugPrint(printStr);
While this is not unworkable, it’s very ugly and takes significantly longer to write strings this way. You could potentially use editor tooling to help alleviate this… in fact I used to have a Sublime Text add-in that I wrote which could convert back and forth between a string literal and an array of char literals. But that’s at best a band aid.
Another alternative would be to write or use some kind of custom pre-processor that can extract the string literals from the shader and replace them with something else. This could seamlessly replace a literal with that uint array monstrosity above. Or you could potentially take it even further and replace the string with some kind of hash or token, and then store the string somewhere accessible on the CPU side so that it can be looked up when the print buffer is read back and resolved. That last approach could potentially be quite a bit more efficient on the shader side by drastically reducing the amount of data that needs to be written to the buffer, but it is more complicated. In particular adding any kind of shader pre-processing is a heavy-handed step, and the decision to take on the associated burdens should not be treated lightly. Some engines have already chosen to do this for other reasons, in which case adding string literal handling would be a smaller incremental cost.
Really neither of these solutions are ideal, particularly for a smaller codebase being used for experimenting or messing around. I filed a GitHub issue on the DXC repo with a request for better string support back in October 2021, but as of January 2024 it still has not had a resolution.
A Cursed Path
Update 05/04/2025: as of the February 2025 release of DXC, the compiler will no longer let you pass a string literal as an argument for a templated function. This new error message was a fix for the below code pattern causing crashes in SPIR-V codegen. That means the StrLen function in the code below no longer works. As a workaround, the for loop on the character count can be replaced with a while loop that checks for the null terminator. Either way, please comment on this feature request to indicate your support if you care about strings in HLSL. Original article contents follow.
Before I go any further I’ll warn that this code is going to be ugly, and is almost certainly relying on unintended functionality in the compiler that just happened to be exposed through templates. It’s very possible this won’t work in the future, so I would not rely on this for anything critical and perhaps it would be safest to avoid it altogether. You’ve been warned!
While experimenting with HLSL 2021, I stumbled upon a way to use a combination of template and macro hacks to work with string literals and extract the characters as integers. It turns out that literals can be passed to templated functions that expect an array of type T, where T is ultimately char even though that type is intentionally not exposed. While indexing into that array doesn’t seem to work, we can make a simple strlen implementation that just uses the size of the array to determine the length of the string literal:
template<typename T, uint N> uint StrLen(T str[N])
{
    // Includes the null terminator
    return N;
}
Nice! As for indexing into the characters of the literal, while we can’t do that from a templated function we can do it by indexing into the literal itself. For example, "Hello"[2]. This means we have to resort to a loop in a macro, but for me this is an acceptable cost of doing business. But we still have one more problem: because of the way that char has been disabled inside of DXC, you can’t actually do useful things with it. This includes any arithmetic, or even casting it to an int or uint. However it turns that there is one thing you can do with it, which is compare it to another character literal. Therefore "Hello"[2] == 'l' will evaluate to true. While this isn’t immediately useful, it does mean we can write the world’s most cursed CharToUint function:
template<typename T> uint CharToUint(in T c)
{
    if(c == 'A')
        return 65;
    if(c == 'B')
        return 66;
    if(c == 'C')
        return 67;
    if(c == 'D')
        return 68;
    if(c == 'E')
        return 69;
    if(c == 'F')
        return 70;
    if(c == 'G')
        return 71;

    // ...and about 90 more cases to handle
  }
Putting it all together, we can finally make a macro that can process the string literal one at a time so that it can be packed into a buffer:
#define DebugPrint(str, ...) do {                            \
    ShaderDebug::DebugPrinter printer;                       \
    printer.Init();                                          \
    const uint strLen = ShaderDebug::StrLen(str);            \
    for(uint i = 0; i < strLen; ++i)                         \
        printer.AppendChar(ShaderDebug::CharToUint(str[i])); \
    printer.StringSize = printer.ByteCount;                  \
    printer.AppendArgs(__VA_ARGS__);                         \
    printer.Commit(ShaderDebug::GetDebugInfo());             \
} while(0)
Amazing? Terrible? Helpful? Morally dangerous? I’m honestly not sure, you’ll have to decide for yourself.
Packing It All Into A Buffer
Now that we’ve covered strings, we’re ready to look how the string and any arguments get packed into our print buffer. You may have noticed that in my DebugPrint macro, I’ve got a DebugPrinter type that’s doing most of the heavy lifting. Let’s hook at how that’s written:
struct DebugPrinter
{
    static const uint BufferSize = 256;
    static const uint BufferSizeInBytes = BufferSize * sizeof(uint);
    uint InternalBuffer[BufferSize];
    uint ByteCount;
    uint StringSize;
    uint ArgCount;

    void Init()
    {
        for(uint i = 0; i < BufferSize; ++i)
            InternalBuffer[i] = 0;
        ByteCount = 0;
        StringSize = 0;
        ArgCount = 0;
    }

    uint CurrBufferIndex()
    {
        return ByteCount / 4;
    }

    uint CurrBufferShift()
    {
        return (ByteCount % 4) * 8;
    }

    void AppendChar(uint c)
    {
        if(ByteCount < BufferSizeInBytes)
        {
            InternalBuffer[CurrBufferIndex()] |= ((c & 0xFF) << CurrBufferShift());
            ByteCount += 1;
        }
    }
Basically we have an internal buffer of uint that we use to store the converted characters, packed as 1 of the 4 bytes in the uint. As we loop over the string literal, we just keep incrementing ByteCount and packing in the data. However for a printf we also want to be able to handle arguments, that way we can print integers and floats and the like. For those we will also pack the data into the internal buffer, but we will also store a special code before each argument to provide the CPU code with the type and size of the argument:
enum ArgCode
{
    DebugPrint_Uint = 0,
    DebugPrint_Uint2,
    DebugPrint_Uint3,
    DebugPrint_Uint4,
    DebugPrint_Int,
    DebugPrint_Int2,
    DebugPrint_Int3,
    DebugPrint_Int4,
    DebugPrint_Float,
    DebugPrint_Float2,
    DebugPrint_Float3,
    DebugPrint_Float4,

    NumDebugPrintArgCodes,
};
template<typename T, uint N> void AppendArgWithCode(ArgCode code, T arg[N])
{
    if(ByteCount + sizeof(arg) > BufferSizeInBytes)
        return;

    if(ArgCount >= MaxDebugPrintArgs)
        return;

    AppendChar(code);
    for(uint elem = 0; elem < N; ++elem)
    {
        for(uint b = 0; b < sizeof(T); ++b)
        {
            AppendChar(asuint(arg[elem]) >> (b * 8));
        }
    }

    ArgCount += 1;
}
To make things work nicely with the arguments passed to the macro, we have some trampoline functions that append each argument individually and pass the correct code to AppendArgWithCode:
void AppendArg(uint x)
{
    uint a[1] = { x };
    AppendArgWithCode(DebugPrint_Uint, a);
}

void AppendArg(uint2 x)
{
    uint a[2] = { x.x, x.y };
    AppendArgWithCode(DebugPrint_Uint2, a);
}

void AppendArg(uint3 x)
{
    uint a[3] = { x.x, x.y, x.z };
    AppendArgWithCode(DebugPrint_Uint3, a);
}

// More of these for floats, signed integers, etc.

void AppendArgs()
{
}

template<typename T0> void AppendArgs(T0 arg0)
{
    AppendArg(arg0);
}

template<typename T0, typename T1> void AppendArgs(T0 arg0, T1 arg1)
{
    AppendArg(arg0);
    AppendArg(arg1);
}

template<typename T0, typename T1, typename T2> void AppendArgs(T0 arg0, T1 arg1, T2 arg2)
{
    AppendArg(arg0);
    AppendArg(arg1);
    AppendArg(arg2);
}

// More of these for higher arg counts
This allows the macro to just do printer.AppendArgs(__VA_ARGS__); and it all works.
Finally we have one last Commit() method on DebugPrinter that actually stores everything into the RWByteAddressBuffer along with a special header:
void Commit(in DebugInfo debugInfo)
{
    if(ByteCount < 2)
        return;

    // Round up to the next multiple of 4 since we work with 4-byte alignment for each print
    ByteCount = ((ByteCount + 3) / 4) * 4;

    RWByteAddressBuffer printBuffer = ResourceDescriptorHeap[debugInfo.PrintBuffer];

    // Increment the atomic counter to allocate space to store the bytes
    const uint numBytesToWrite = ByteCount + sizeof(DebugPrintHeader);
    uint offset = 0;
    printBuffer.InterlockedAdd(0, numBytesToWrite, offset);

    // Account for the atomic counter at the beginning of the buffer
    offset += sizeof(uint);

    if((offset + numBytesToWrite) > debugInfo.PrintBufferSize)
        return;

    // Store the header
    DebugPrintHeader header;
    header.NumBytes = ByteCount;
    header.StringSize = StringSize;
    header.NumArgs = ArgCount;

    printBuffer.Store<DebugPrintHeader>(offset, header);
    offset += sizeof(DebugPrintHeader);

    // Store the buffer data
    for(uint i = 0; i < ByteCount / 4; ++i)
        printBuffer.Store(offset + (i * sizeof(uint)), InternalBuffer[i]);
}
In Commit() we’re assuming there’s a counter at the start of the print buffer that indicates how many bytes have been written to it. By atomically incrementing that counter we can safely “allocate” some space for our print data, and also ensure that enough space is left so that we can early-out if the buffer is full. Once the counter is incremented we fill out our small header and write that first, then write the contents of the internal buffer one uint at a time.
While there’s some complexity and ugliness here that we need to hide in an included file, actually doing a print in the shader code is about as easy as it gets:
float3 color = ComputeColor();
DebugPrint("The color is {0}", color);
Since we’re embedding the argument type as a code in the buffer, there’s no need for printf-style format specifiers and we can instead use argument IDs like in std::format or C#’s String.Format.
Reading Back On The CPU
In order to have the CPU process all of the print data that’s been generated on the GPU, we need to issue some commands that copies the print buffer to a CPU-accessible readback buffer:
void EndRender(ID3D12GraphicsCommandList7* cmdList)
{
    PIXMarker marker(cmdList, "ShaderDebug - EndRender");

    DX12::Barrier(cmdList, PrintBuffer.WriteToReadBarrier( { .SyncAfter = D3D12_BARRIER_SYNC_COPY,
                                                             .AccessAfter = D3D12_BARRIER_ACCESS_COPY_SOURCE } ));

    const ReadbackBuffer& readbackBuffer = PrintReadbackBuffers[DX12::CurrentCPUFrame % DX12::RenderLatency];
    cmdList->CopyResource(readbackBuffer.Resource, PrintBuffer.Resource());
}
Doing the copy to the readback buffer allows us to map and read the oldest generated print buffer data every frame so that we can process it:
if(DX12::CurrentCPUFrame >= DX12::RenderLatency)
{
const ReadbackBuffer& readbackBuffer = PrintReadbackBuffers[(DX12::CurrentCPUFrame + 1) % DX12::RenderLatency];
DebugPrintReader printReader(readbackBuffer.Map<uint8>(), uint32(readbackBuffer.Size));
while(printReader.HasMoreData(sizeof(DebugPrintHeader)))
{
const DebugPrintHeader header = printReader.Consume<DebugPrintHeader>(DebugPrintHeader{});
if(header.NumBytes == 0 || printReader.HasMoreData(header.NumBytes) == false)
break;
std::string formatStr = printReader.ConsumeString(header.StringSize);
if(formatStr.length() == 0)
break;
if(header.NumArgs > MaxDebugPrintArgs)
break;
argStrings.Reserve(header.NumArgs);
for(uint32 argIdx = 0; argIdx < header.NumArgs; ++argIdx)
{
const ArgCode argCode = (ArgCode)printReader.Consume<uint8>(0xFF);
if(argCode >= NumDebugPrintArgCodes)
break;
const uint32 argSize = ArgCodeSizes[argCode];
if(printReader.HasMoreData(argSize) == false)
break;
const std::string argStr = MakeArgString(printReader, argCode);
ReplaceStringInPlace(formatStr, ArgPlaceHolders[argIdx], argStr);
}
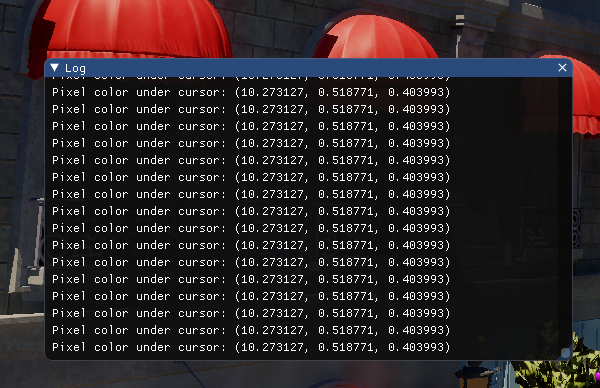
GlobalApp->AddToLog(formatStr.c_str());
}
readbackBuffer.Unmap();
}
The processing involves a loop that iterates until all of the print data in the buffer has been processed. For each iteration of the loop, we pull out a DebugPrintHeader that marks the beginning of a single DebugPrint call from a single thread of a shader. That header is then used to gather the actual format string, as well as the number of argument. Each argument is extracted using the code we embedded on the shader side, and a stringified version of the argument is then inserted into the original print string to replace the argument index. The final expanded string with arguments is then passed on to my simple log system, but at that point you could do whatever you’d like with it. In my case the log outputs to a simple ImGui text window, but you can get as fancy as you want.
Going Beyond Printf
Having a shader printf is already hugely valuable and worthwhile, but once you have this sort of infrastructure in place there’s all kinds of things you can do with it. For example you could build a higher-level assert mechanism on top of DebugPrint that logs information when a condition isn’t met. The __FILE__ and __LINE__ predefined macros work in DXC, so you could include that along with the condition itself in the log message. Unfortunately there’s no way I know of to get any kind of “stack strace”, so you’re on your own for that. There also isn’t a standard __debugbreak() intrinsic or anything like that for shaders. The best you can do is enter an infinite loop or force a deliberate page fault, and hope that your GPU crash reporting systems catch it appropriately.
Another common trick is to implement shader-driven debug rendering. If you have a CPU-based debug renderer then it’s pretty straightforward to add special “print” code that can be detected on the CPU, which can then extract and forward the draw arguments to the debug renderer. The main downside of doing it this way is that you’ll need to accept a few frames of latency between when the shader draws and when it shows up. For a lot of cases this is totally fine, but it can be a dealbreaker for certain debugging scenarios. A zero-latency alternative is to have a separate buffer for debug draws, and run a compute shader to process that and convert it into indirect draw commands.
Once you take it to the extreme, your print system can basically be a deferred message passing interface between your shaders and the engine. This could potentially be used for all kinds of powerful or wacky things if you’re sufficiently motivated. For example, you could replicate a subset of the Dear ImGui interface in your shader, and give your shaders the ability to draw their own debug UI. The sky is the limit!
CR LF
That’s it for the article! Hopefully what I’ve described is helpful for people implementing similar systems, or provides some ideas for how to improve existing ones. Good luck, and happy printing!
-
HLSL has actually had a printf intrinsic since the D3D11 days. Unfortunately no driver or tool has ever supported it outside of the old software REF device, which was really only used for validation. ↩︎