D3D Performance and Debugging Tools Round-Up: PIX
So at this point just everybody knows about knows about PIX. I mean it comes with the DirectX SDK, for crying out loud. This handy little program started its like as the Performance Investigator for Xbox (original Xbox, that is) and today is useful performance and debugging tool for both Windows and the Xbox 360. Since it’s a DirectX tool, most of the information you can gather from it is hardware-independent. For instance it can easily tell you how many DrawIndexedPrimitives calls you’re making, but it can’t tell you whether the GPU is bound by texture bandwidth. For that reason I find that PIX is much more useful for debugging as opposed to performance investigations. However it can be useful when your performance is held up by API calls (since it can tell you where you’re making them in a frame, and how many) and in Vista/Win7 it has access to GPU timing information that cam tell you how much time per frame the GPU is working, idle, or waiting for resources. Another nice thing about PIX is that it now has full support for D3D11 as of the new February 2010 SDK, which unfortunately isn’t the case for NVPerfHUD.
If you’re an XNA programmer I’d recommend checking out my in-depth PIX With XNA article, especially if you’re new to D3D in general. For rest of you, here’s a summary of what I think are the most useful things you can do with PIX:
1. View the results of a Draw call
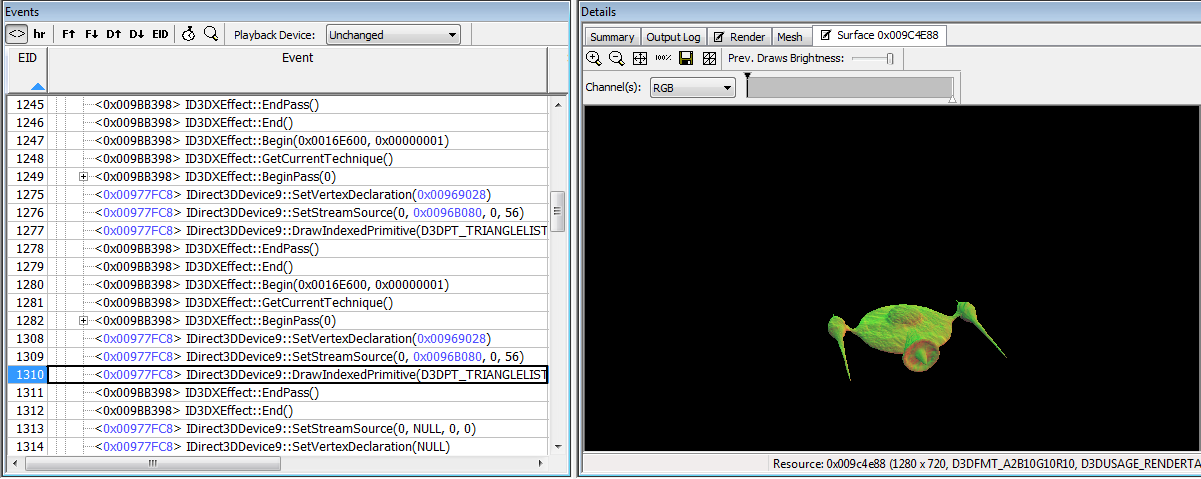
With everyone and their mother using a deferred renderer these days, more often than not what’s displayed on the screen is the result of several passes. This means that when things go wrong, it’s hard to guess the problem since it could have occurred in multiple places. Fortunately PIX can help us by letting us pick any singular Draw call and see exactly what was drawn to the screen. All you have to do s capture a frame, find the Draw call in the Event view, and then click on the “Render” tab in the Details view. Here’s a screenshot I took showing what was drawn to the normal-specular buffer during the G-Buffer pass of my Inferred Rendering Sample:
2. View device state at any point in frame
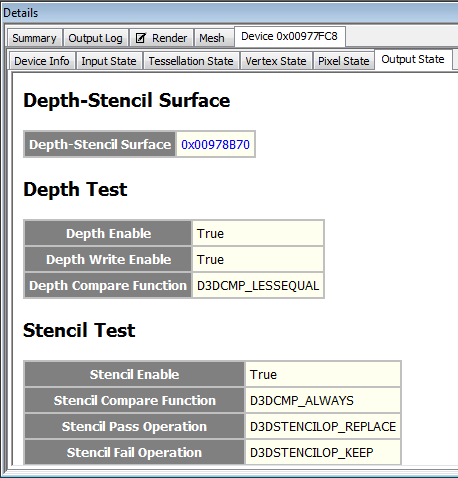
Ever have a problem where something wasn’t drawing, and it turned out you left alpha-testing enabled or something silly like that? I know it’s happened to me. If it happens again, you can help diagnose the problem by using PIX to view the state of your device at the time of a Draw call (or at any other point in the frame, for that matter). To do it you capture a frame, find the Draw call or other Event you’re interested in, and then find the device in your Objects view (filtering by Type can help). Then you just right-click on the device, click “View Device”, and have a look at the tab that appears in the Details view. It looks something like this:
3. View mesh data for a draw call
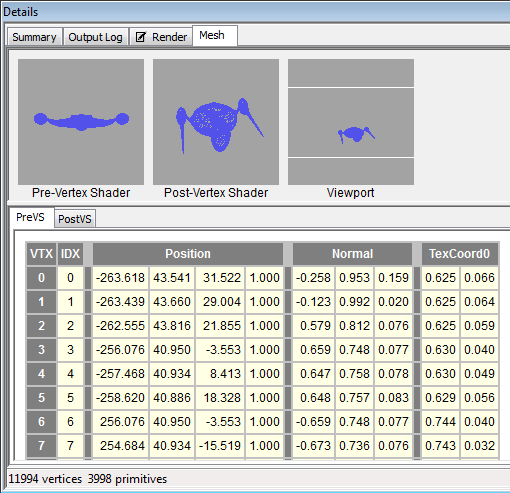
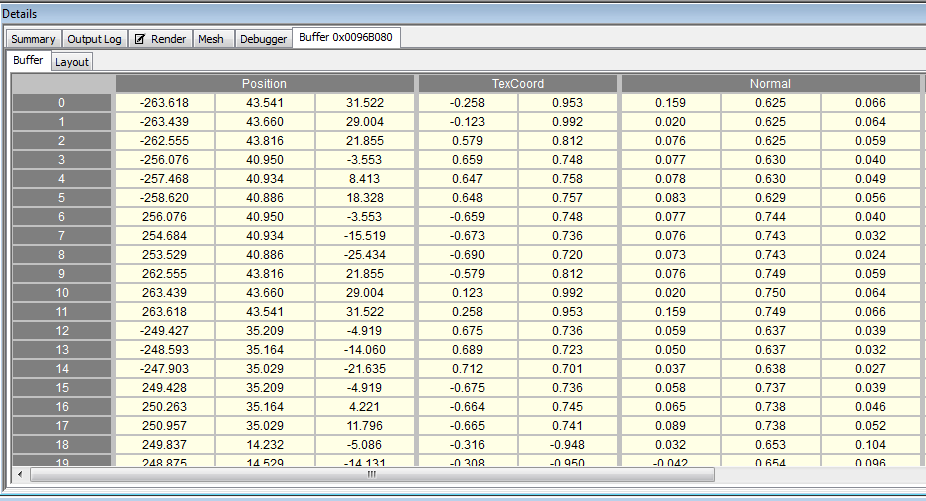
Doing this lets you see what your vertex data looks like before and after your vertex shader (also before and after your geometry shader, if you’re using D3D10 or D3D11). Just capture a frame, click on the Draw event, and click on the Mesh tab in the Details view.
4. Debug shaders
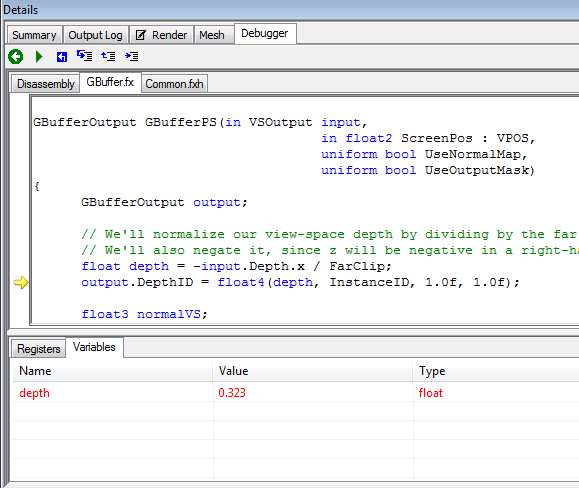
I don’t I need to mention why this is useful. With PIX you can step through both the compiled assembly and HLSL code for your shader. The easiest way to start debugging is to view the pixel history of a pixel by right-clicking on it in the Render tab, and then click on the links displayed for a Draw event.
5. View textures, render targets, buffers, depth/stencil surfaces, and vertex declarations
You can view the contents of all of these things just by finding them in the Objects view and right-clicking. Like everything else in PIX, what’s displayed will reflect the current state of the object based on the event you’ve selected in the Event view. For vertex buffers you’ll also need to specify the vertex format using an HLSL-like syntax, which is really easy to do.
6. View a CPU/GPU timing graph (Vista/Win7 only)
If you select the “Statistics for each frame” option when starting your experiment, one of the things you’ll get is a timeline showing your CPU and GPU work for the frames captured. This let’s you easily view whether the GPU is idling or hard at work (which makes it simple to determine if you’re CPU or GPU-bound). It also can show you where GPU work is done in relation to a frame being submitted by the CPU, so you can tell if the CPU is working one or more frames ahead of the GPU.
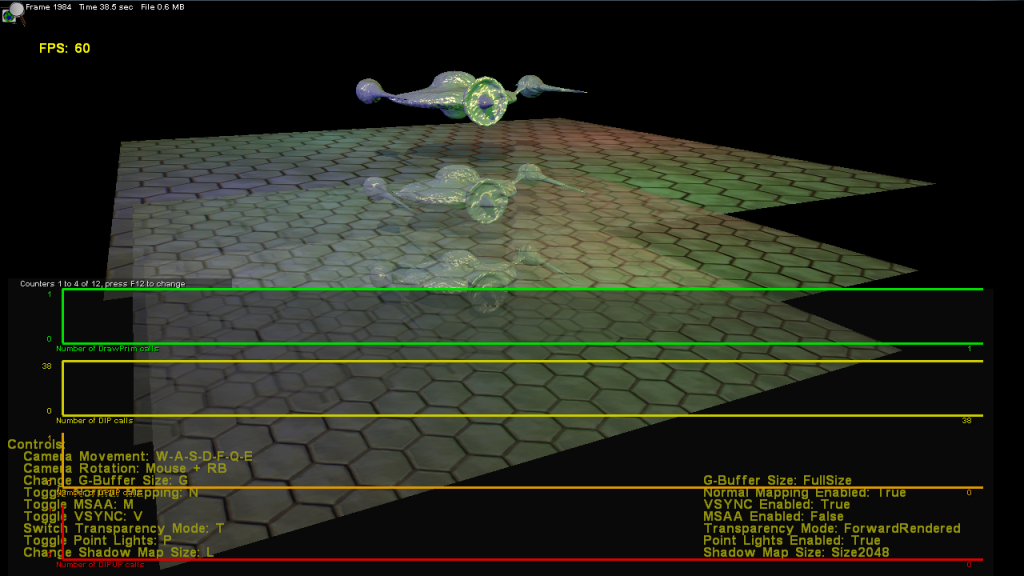
7. Record performance counter values for a frame, and show them on a HUD
PIX has a number of counters available that let you keep track of things like the number of Draw calls or the number of SetTexture calls in a frame. When you create a new experiment and you select the “Statistics for each frame” option, it will let you pick from a selection countersets provided by PIX. To see which counters are included in a counterset or to make your own, click the “More Options” button, click the “Set Counters” action, and then click on “Customize”. In this dialog you can pick through all of the D3D counters provided by PIX, or add in any of the standard Windows Performance Counters installed on your system. Also note that vendor–specific tools like NVPerkKit will install plugins for PIX that let you add in hardware-specific counters.
If you enable the HUD for your experiment, you’ll get something that looks like this when running your app:
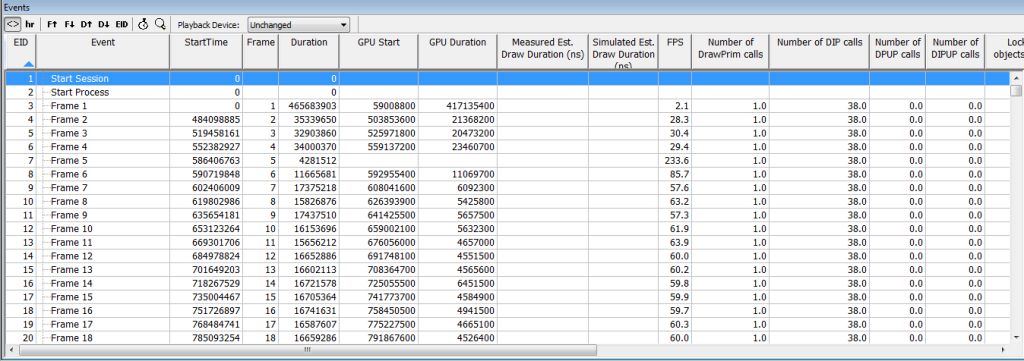
Either way once you close your app and you’re viewing the experiment results, the Events view will display the value of all active counters for each frame.
Useful Tips:
-
If you’re going to debug shaders and you don’t to have to step through the assembly, make sure you compile them with the DEBUG flag. This embeds debugging info in the compiled bytecode, including a path to the HLSL source code file. You’ll also want to disable optimization if possible, otherwise you’ll find that the compiler usually aggressively reorders your code. XNA users: the Effect processor will enable the DEBUG flag when you perform Debug builds, and it will attempt to disable optimizations. If you’re using a vs_2_0 or ps_2_0 shader it’s possible that disabling optimizations will cause you to go over the instruction limit, in which case the processor will re-enable optimizations.
-
Add markers to your app! PIX has a small list of functions that lets you mark off portions of a frame, which causes PIX to collapse all of the events that occurred in the marked area. So for instance you could add a marker for “G-Buffer Pass”, which lets you easily find draw calls made to build your G-Buffer. If you’re using XNA my sample includes a handy “PIXHelper” class that has pinvokes declared for those functions, as well as extension methods for SpriteMatch and Model.
-
Use the “D” buttons in the Events view to quickly iterate through your Draw calls
-
If you want to use the HUD and you’re using D3D9, make sure you Present with the implicit swap chain created with the device
-
With D3D9 disable multisampling if you’re going to capture a frame. PIX doesn’t like it.
Comments:
Tools And Fools « Sgt. Conker -
[…] Start with PIX. […]
