D3D Performance and Debugging Tools Round-Up: PerfHUD
Officially, Nvidia’s PerfHUD is a performance-monitoring and debugging application for use with Nvidia GPU’s. Unofficially, it’s pure awesomeness for a graphics programmer. While I personally find PIX to be a more useful tool when it comes to debugging, the fact that PerfHUD gives you hardware-specific details makes it infinitely more useful for profiling. At work I find myself using it every time there’s a performance issue on the PC. Here’s some of the things I like to do with it (warning, it’s a long list!):
1. View driver time and GPU idle time per frame
When doing graphics in Windows, something you always need to be wary of is spending too much time sitting around in the driver instead of giving the GPU enough work to do. With PerfHUD instead of looking at the number of Draw/SetRenderState/SetTexture calls and guessing their impact (although PerfHUD will show you these values if you want), you get a nice sweet graph that shows you your driver time, GPU idle time, and total frame time.
These graphics make it very obvious whether your app is CPU-bound or GPU-bound, and if you are CPU-bound you can tell whether it’s because you’re spending too much time in the driver.
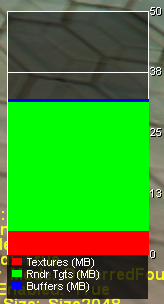
2. View memory usage
Want to know how much memory your app is using? PerfHUD tells you.
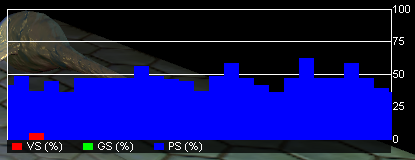
3. View shader utilization stats
The default PerfHUD layout includes a graph showing you which percentage of unified shaders are being used for different shader types. This lets you know if you’re spending a lot of time in vertex, geometry, or pixel shaders.
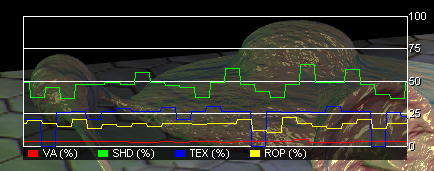
4. View GPU pipeline usage states
The default layout also has a graph showing you how much you’re using the input assembler, shader units, texture units, and ROP’s:
5. Customize the graphs
Above I used the term “default layout” a few times. I do this because the initial layout you get isn’t fixed, and you can customize it. You can add new graphs, move them, remove them, and customize the data shown on a graph. This lets pick and choose from the various performance counters available, and also change how the data is displayed. For instance you can select ranges, or switch between frame percentage or raw time.
6. Run instant global experiments
PerfHUD has hot-keys that let you toggle different experiments on and off. These include:
-Swap out all textures for 2x2 textures (removes texture bandwidth usage) -Use a 1x1 viewport (removes pixel shading usage) -Ignore all Draw calls (isolates the CPU) -Eliminate geometry (removes vertex shader/input assembler usage)
You can also show wireframes, depth complexity (which shows your overdraw), and also highlight different pixel shader profiles.
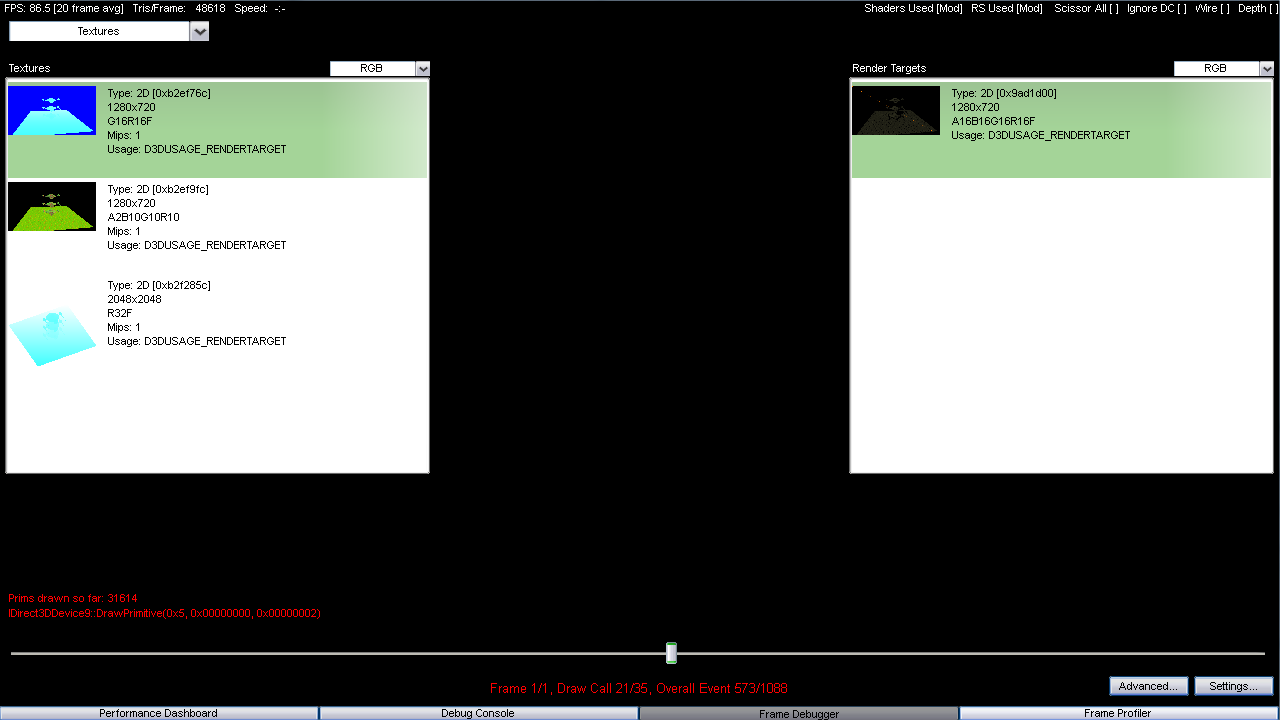
7. View textures and render targets for a draw call
This is something you can do in PIX so it’s not that smile, but I’m mentioning this because PerfHUD makes it easier to view all of the textures and render targets at the same time. In PIX you have to look at the debug state and open a new tab in the Details view for each texture/RT, which is kinda annoying. Also note that when you do this the current state of the backbuffer is shown on the screen, with the current Draw call highlighted in orange. You don’t see anything in my picture since the app doesn’t draw anything to the backbuffer until the final step.
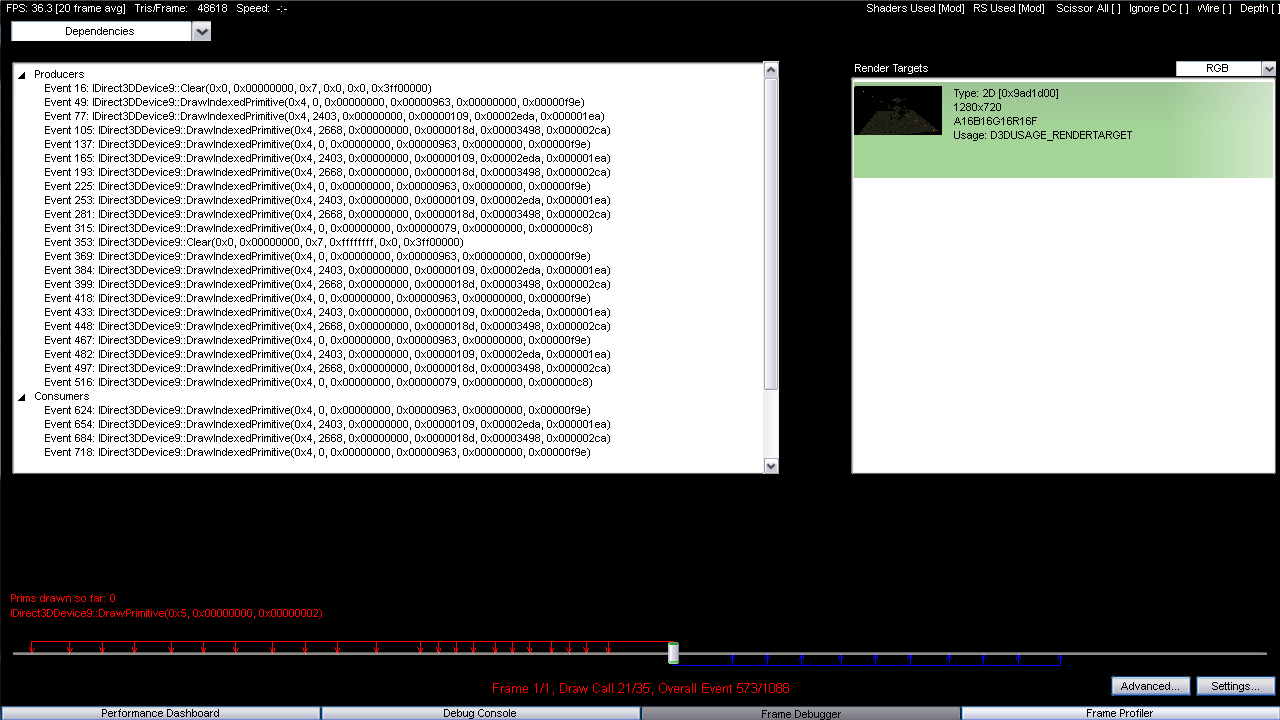
8. View dependencies for a Draw call
This is actually a pretty neat debugging feature. PerfHUD basically gives you a list of all previous Draw calls whose results are used by the current Draw call. It will also show which future Draw calls use the results from the current Draw call.
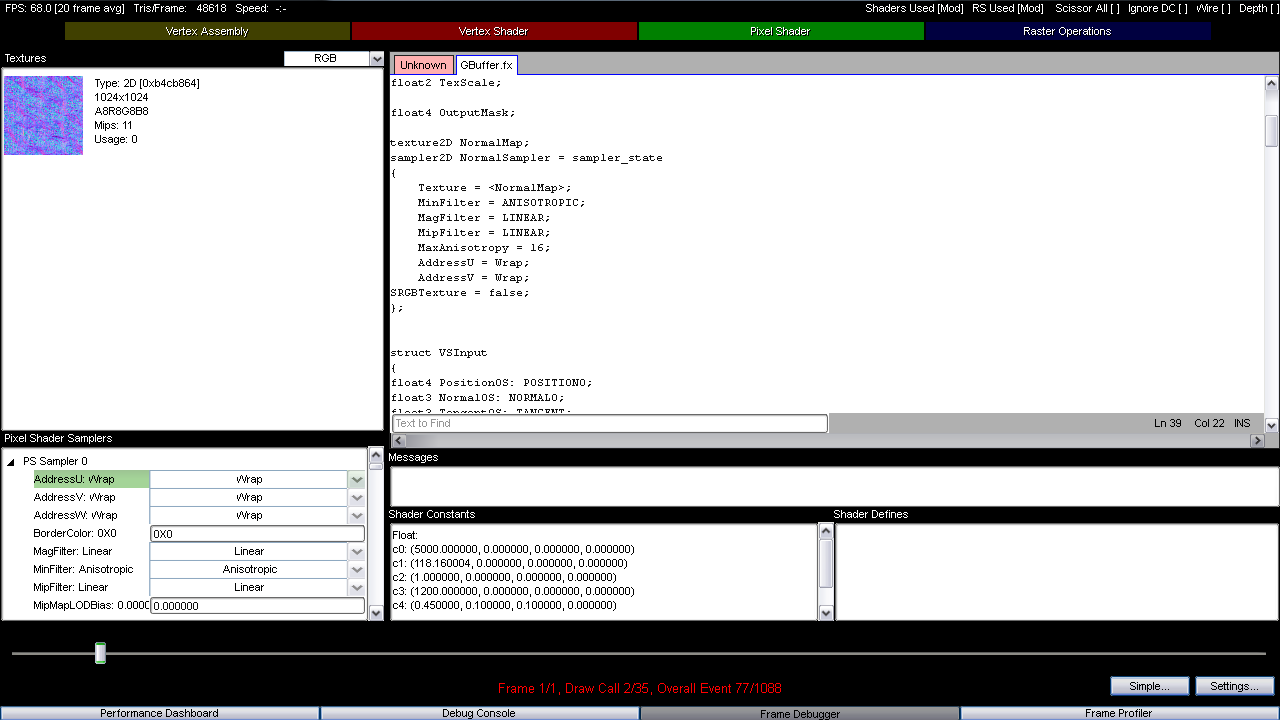
9. View and modify states for a Draw call
PIX is really good at letting you see the current device state at a certain point in a frame, but PerfHUD takes this a step further by letting you modify them and instantly view the results.
10. View and modify shaders
PerfHUD doesn’t let you debug shaders like PIX can, but it does let you modify a shader and see the live changes in your app. You can also load up any shader from file, compile it, and replace that shader.
11. Replace textures with special debugging textures
In the Frame Debugger, you can replace a specific texture with one of the following:
-
2x2 texture
-
Black, 25% gray, 50% gray, 75% gray, white textures
-
Vertical and horizontal gradients
-
Mipmap visualization texture
Here’s a screenshot showing the mipmap visualization texture applied as the diffuse albedo texture for all meshes:
12. View comprehensive performance statistics
The Frame Profiler is easily the coolest part about PerfHUD. It presents you with a whole slew of information about what’s going on with the GPU for different parts of a frame, and makes it easy to figure out which parts of your frame are the most expensive for different parts of the GPU pipeline. In fact, PerfHUD will automatically figure out the most expensive draw calls and indicate it for you. I’m not going to go through each feature in detail since I want this post to stay readable, but I’ll give you a list:
-
View the bottleneck or utilization time per unit for a Draw call, state bucket (a state bucket is a group of draw calls that have similiar performance and bottleneck charactistics, meaning that if you reduce a particular bottleneck all Draw calls in the state bucket are likely to be quicker)
-
View a graph of bottleneck or utilization percentages for all all Draw calls in a frame
-
View a graph of CPU and GPU timing info
-
View a graph of the number of pixels shaded per Draw call
-
View a graph of the texture LOD level for all Draw calls
-
View a graph of the number of primitives and screen coverage per Draw call
The following image shows the frame profiler in action. The graph is showing the bottleneck percentage per Draw call, and the selected Draw call is in the shadowmap generation pass. As you’d expect, the call is primarily bound by the input assembler stage since the shaders are so simple. You can also see that PerfHUD grouped all of the other shadow map generation Draw calls into the same state bucket.
Useful Tips:
-
PerfHUD itself is actually just a layer on top of Nvidia’s PerfKit, which is a library that lets you access hardware and driver-specific performance counters. If you wanted you could just use those API’s yourself and display the information on-screen, or integrate it into in-house profiling tools. In fact Nvidia’s provides a PIX plugin, which lets PIX display and record them just like any other other standard performance counter. However the catch is that a lot of the hardware counters aren’t updated every frame, which makes it difficult to use them to figure out bottlenecks. You also have the problem that it’s difficult to figure out bottlenecks for a specific portion of the frame, since you can’t query the counters multiple times per frame. The PerfHUD Frame Profiler makes this all easy by automatically running a frame multiple times, allowing it to gather sufficient information from the hardware performance counters. You could of course do this yourself, but it’s a lot easier to just use PerfHUD.
-
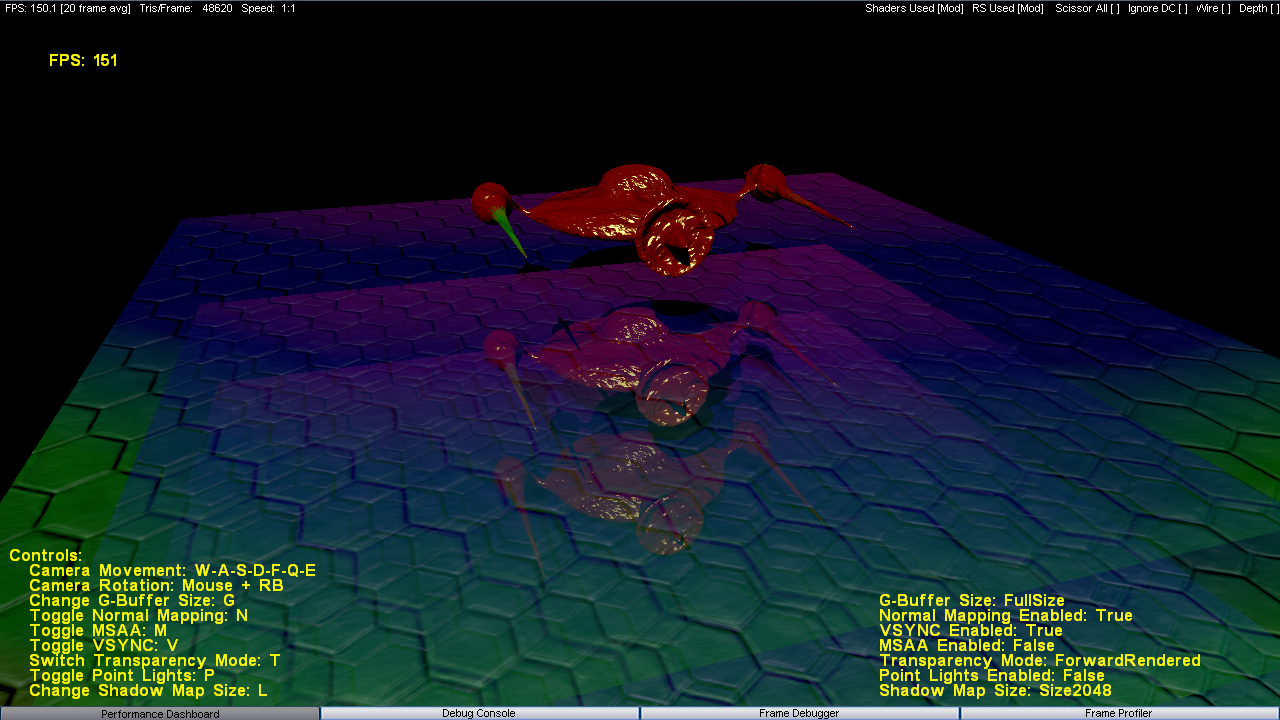
PerfHUD is totally usable for XNA apps. In fact, all of those screenshots are from my InferredRendering sample. To run an app with PerfHUD you have to query for the PerfHUD adapter on startup, and use it if it’s available. The user guide gives sample code for doing this in DX9, and it’s even easier with XNA.In your constructor, add a handler for the GraphicsDeviceManager.PreparingDeviceSettings event:
graphics.PreparingDeviceSettings += graphics\_PreparingDeviceSettings;Then in your event handler, use this code:
foreach (GraphicsAdapter adapter in GraphicsAdapter.Adapters) { if (adapter.Description.Contains("PerfHUD")) { e.GraphicsDeviceInformation.Adapter = adapter; e.GraphicsDeviceInformation.DeviceType = DeviceType.Reference; break; } } -
Be careful using PerfHUD when your app is running in windowed mode. Closing the window can cause it to crash.
Comments:
Using Nvidia PerfHUD with XNA 4.0 | The Stolen Journals -
[…] the PerfHUD performance profiling overlay. There’s a good overview of the interface by MJP, here. Tweet This entry was posted in Uncategorized. Bookmark the permalink. ← Acronym […]
#### [Performance Tools: PerfHUD « Sgt. Conker](http://www.sgtconker.com/2010/03/performance-tools-perfhud/ "") -
[…] Matt “Perf Analyzer” Pettineo has a new post about analyzing Direct3D performance using NVIDIA PerfHUD, where he goes into great deal about each feature of the tool. Read all about it on his blog. […]
#### [Pete](http://amapplease.blogspot.com "ultrahead@msn.com") -
Great info! You should also check “Nexus”: http://developer.nvidia.com/object/nexus.html
#### [Popcorn]( "corbin@skymo.com") -
xna will set SoftwareVertexProcessing mode when perfhud is being used due to perfhud requirement for Reference device setting how do you work around that? I get 1 frame every 30 to 40 seconds with my app perfhud is unusable for me
#### [Intermission #8–What’s gone wrong? - Dark Genesis](http://xna-uk.net/blogs/darkgenesis/archive/2010/07/16/intermission-8-what-s-gone-wrong.aspx "") -
[…] of the Direct X SDK) NVIDIA PERFHud (part of the Nvidia PerfSDK) – Useful Post here on how to get the most of this in XNA AMD PerfTools The […]
#### [ozlael](http://ozlael.egloos.com "") -
Always thank you for useful article. Can i copy this post to my blog and translate into korean?
#### [Chris]( "Christian.Schlager@gmail.com") -
In XNA 4.0 the member GraphicsDeviceInformation.DeviceType is gone. When I try to start my test game with PerfHUD it says: No suitable graphics card found. Unable to create the graphics device. What can I do? Thanks :)

