Ten Years of D3D12

For those of us that have been using it from the start, it can be hard to believe that Direct3D 12 has been around for ten years now. Windows 10 was released on July 29th 2015, and D3D12 has been with us ever since. While it’s true that this is the longest we’ve gone between major D3D version updates, it’s also not fair to say that the API has remained static. On the contrary, D3D12 has received a steady stream of new interfaces, functions, and shader models. These updates have included some very major features that have gathered lots of press and attention, such as DXR or Work Graphs. But there’s also been a long line of smaller features and quality-of-life updates that can make a developer’s life easier. In addition, HLSL as a shader language has also seen steady updates, with some of them being rather transformative.
Given the recently-passed 10 year anniversary, I thought it would be a good time to look back at what’s changed in the world of D3D12 since it was released. After that, I thought it would also be interesting to reflect on what’s changed for me personally as my coding and development style has evolved along with APIs and programming languages. In some cases I’ve been able to streamline things quite a bit thanks to API enhancements, and in others I’ve just embraced new ways of doing things.
Let’s dive In! Feel free to use the TOC below if you want to skip around.
Additions To the Core D3D12 API
Programmable Sample Points
This is not a commonly used feature, since its use cases are pretty niche and MSAA is no longer popular. In short, this adds a new API that lets you provide your own custom MSAA subsample positions instead of using the rotated grid pattern that the “standard” sample provides:
The API allows you to specify the positions over a 2x2 quad of pixels rather than just a single pixel, which you could potentially use to get a more irregular sampling pattern that changes aliasing characteristics. Or at least, you can do that if you still care about MSAA. :)
The other main use case is for software implementations of variable rate shading, which is something that Activition has presented in the past on more than one occasion. It’s also something I’ve dabbled in myself in the past. The reason programmable sample points are useful is so that you can generate a “half-res” depth buffer with 4x MSAA and have the depth subsample positions exactly match what was used for the full-res pass. Of course these days you also have hardware VRS as another option (which we’ll get to soon!), which renders this use case fairly niche.
View Instancing
Another less-commonly-used feature is View Instancing. This provides API and shader mechanisms that try to make it easy and optimal to render in stereo for VR or 3D. The way it works is your draws will get instanced N times (for up to 4 views), and in any shader you can take SV_ViewID as an input to know which view you’re drawing to. This allows you to choose and apply the appropriate view + projection matrices for that view. Then on the app side of things you specify whether you want each view to get mapped to a different viewport, or to a different slice of an array texture. You can also setup a bitfield mask on the app side, which allows you to cull separately for each view if you want to.
In theory this API could benefit hardware that has some native functionality for broadcasting to multiple views if used correctly, which as far as I know is really just Nvidia with its “viewport broadcast” feature of the GS. In practice I’m not sure it really provided any serious benefit, since I imagine most apps would consume SV_ViewID in the vertex shader rather than trying to use it later in the pipeline. AMD also has never exposed more than Tier 1 support, which means there’s some sort of “draw-call level looping” going on rather than anything fancy. If that’s the case, you’re likely better off by just doing it yourself with regular instancing + SV_RenderTargetArrayIndex/SV_ViewportArrayIndex being output by the vertex shader.
Depth Bounds Test
The depth bounds test is old…so old it was initially added to accelerate stencil shadows. Remember when Doom 3 was new? It’s been exposed in other APIs in various ways, but somehow it never got officially added to D3D until D3D12. Either way it’s now exposed if you have a good use for it. Basically how it works is on the command list you specify a min and max depth value which serve as the “bounds”. Then when you draw some triangles, each pixel checks the existing depth value (not the depth of the triangle being rasterized) and passes the depth test if the value is within the bounds that were provided.
I’m not sure what use cases are still out there for this feature…I know some renderers have used it for old-school style deferred rendering where light bounding volumes were rasterized one at a time. Deferred decals that are rasterized as bounding boxes could also potentially benefit in the same way. There’s also an old trick from the PS3 days for rendering deferred cascaded shadows one cascade at a time, where you would set the depth bounds to the cascade min/max depth and then draw a full-screen triangle.
Variable Rate Shading
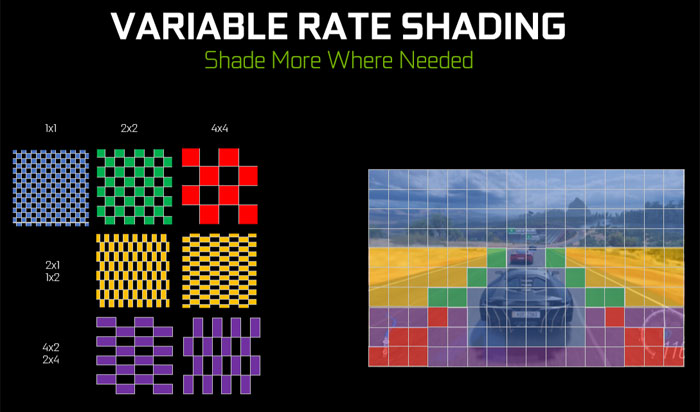
Variable Rate Shading, or VRS for short, is all about trying to reduce expensive pixel shader threads for places where you don’t need it. The idea is that you choose a “shading rate”, and then the pixel shader will only run for 1 / N pixels. The nice part is that you still get full-resolution depth testing, which you won’t get if you draw things to a separate half-res render target. VRS also gives you very fine granularity for choosing the shading rate, which makes it much easier to mix lower shading rate content with full shading rate content. That can be particularly important for particles and transparents if not using OIT, since you need to draw them in back-to-front order. A separate half-res pass with a composite makes draw-based sorting impossible without introducing many low-res passes, which would end up negating any performance benefits.
The API allows you to specify the shading rate in 3 ways:
- Per-draw, from the command list
- Per-primitive, by emitting
SV_ShadingRatefrom a vertex shader/mesh shader/geometry shader - Per-tile in screenspace, by generating a shading-rate texture (with maximum 16x16 tile size)
In particular the tile-based shading rate is useful if you want to try to analyze the previous frame contents and use that to automatically generate an optimized shading rate based on the variance of the content. Whereas per-draw is probably more useful for manually tagging half-res transparent or particle draws.
There’s two main downsides to watch out for with VRS:
- The performance gains may not be as high as you’d expect, because the hardware is still going to need to launch pixel shaders in 2x2 quads and is also still going to need to fill full waves before it can execute.
- Any low-res draws or tiles will broadcast the coarse pixel output value to the actual pixels, effectively point sampling the results. So you probably want to add some extra spatial filtering and/or temporal reconstruction to get better quality.
Relaxed Format Casting
This is not so much a new API feature as it as a relaxing of the rules around creating multiple views with “compatible” formats. Initially in D3D12 the rules were the same as D3D11, which required you to create a texture resource with a TYPELESS format if you were going to view it through multiple compatible formats. So for example you would use R16_TYPELESS if you were going to view the texture as both R16_UINT and R16_UNORM. This is a bit inconvenient, since you have to know in advance if you’re going to view the resource with multiple formats. It can also result in pessimizations from the driver, since it may not be able to use certain compressions or optimizations if it has to assume that you will view the texture as both integer and floating-point data.
With relaxed format casting this is no longer necessary: you can create the resource fully “typed”, and then create compatible views all you’d like. The catch is that you can’t cast between floating-point and non-floating point formats, which avoids the situation you can get with TYPELESS where the driver might disable optimizations. This is especially nice for depth buffers, which previously required you to use TYPELESS if you were ever going to read the depth texture through a SRV.
Directly Writing To Block-Compressed Formats
Historically, the only way for the GPU to write to a texture with a block compressed format was to copy to it. To allow for performing block compression on the GPU, there was a “backdoor” added in D3D10 that allowed you to copy from a 1/4 width and 1/4 height texture with an equivalent UINT format (R32G32_UINT or R32G32B32A32_UINT) into a BC-formatted texture. This is obviously not ideal, since it would be faster to just write directly to the final texture instead of requiring an intermediary copy. As part of Enhanced Barriers (which I’ll cover later), D3D12 caught up with Vulkan and gained the ability to write directly to the BC texture through a UAV. The way it works is similar to Vulkan: when you create the texture you pass a “castable formats” array, and that allows you to include the equivalent UINT format that you’ll use for writing:
- R32G32_UINT (8 bytes per block) for BC1 and BC4
- R32G32B32A32_UINT (16 bytes per block) for BC2, BC3, BC5, BC6, and BC7
Writable R9G9B9E5 Textures
DXGI_FORMAT_R9G9B9E5_SHAREDEXP is an interesting format: it’s similar to R11G11B10_FLOAT in that it allows for storing positive floating point RGB values with 4 bytes per texel, and provides the same effective range as fp10/fp11/fp16 by virtue of having same number (5) of exponent bits. However unlike fp10/11, with R9G9B9E5 each channel gets 9 mantissa bits instead of the 6 or 5 that you get with R11G11B10. Therefore it can provide more precision and less visible banding in some cases. The catch is that the exponent is shared among the 3 channels, so it’s going to work best when the overall magnitude is highly correlated among the 3 channels.
Traditionally this was a read-only format, where GPUs could automatically decode from it when sampling as a texture but had no means of automatically encoding to it for RTV or UAV writes. Your only option would be to write to it through a UAV that uses R32_UINT, and encode the bits yourself. With this new feature, capable GPUs can indicate that they support writing to DXGI_FORMAT_R9G9B9E5_SHAREDEXP through render targets or typed UAVs.
At the time of writing, support for this feature seems to be limited to AMD GPUs that are RDNA2 or newer.
WriteBufferImmediate and OpenExistingHeapFromAddress
If you write D3D12 code, you’re eventually going to crash the GPU. When this happens, it’s nice to have even some vague information about what the GPU was doing when it gave up the ghost. WriteBufferImmediate and OpenExistingHeapFromAddress are a pair of APIs that aim to let you gather this sort of information by implementing “breadcrumbs”. Basically you use WriteBufferImmediate to write some sort of signal value at various points in your command list recording. Then when your device is removed, you use OpenExistingHeapFromAddress to access the breadcrumb buffer on the CPU and inspect it to figure out the last-written breadcrumb.
This functionality is also used under-the-hood by DRED, which I’ll cover in more detail later on.
GPU Upload Heaps
One of the early pain points for beginner D3D12 programmers is dealing with the fact that dedicated video cards have their own physical pool of VRAM that’s separate from the “SysRAM” that’s used by the CPU. Traditionally VRAM has not been directly accessible to the CPU, aside from small 256 MB region of VRAM accessible through the Base Address Register (BAR). This leads to tough choices about where to place resources, and how to use the GPU to copy from SysRAM to VRAM.
New systems and video cards have something called “Resizable BAR” which allows the OS to effectively map all of VRAM into the CPU address space. D3D12 exposes this functionality through GPU Upload Heaps. This is a new D3D12_HEAP_TYPE_GPU_UPLOAD enum value that you can use when creating a heap or committed resource, which can then be mapped into the CPU virtual address space using Map(). That means you can have the CPU directly update the contents of a resource that lives in VRAM, without having to use GPU copies. For CPU-updated buffers this a no-brainer: the data layout is linear and so you can just memcpy away. For textures it’s a bit more complicated…they use an opaque layout, and so you have to use WriteToSubresource if you want to update the contents.
AMD started supporting ReBAR for RDNA2, and Nvidia started supporting it for Ampere. Intel’s dedicated GPUs all support it. Note that you typically need to enable ReBAR in your UEFI settings before it can be used. GPU Upload Heaps are also unfortunately only available on Windows 11, since it required kernel changes.
ExecuteIndirect Incrementing Constant
ExecuteIndirect is really cool. It wraps up indirect drawing, indirect dispatches, and multi-draw/dispatch through a unified interface. But one major deficiency relative to Vulkan has been the lack of a “DrawID” that the shader can use to access its draw-specific or mesh-specific data. ExecuteIndirect is flexible enough to let you do this yourself by setting a root constant for each draw as part of your command signature, but it turns out that this requires some rather fancy footwork from drivers to make this run as expected. Whereas generating a DrawID is something a lot of hardware can do natively.
Incrementing constant (mostly) closes this gap by letting you have an implicit constant buffer value passed to your shader that increments for each draw or dispatch. While it’s not quite as nice as a SV_DrawID would be, it gets the job done.
At the time of writing this, Nvidia is the only vendor that reports support for Tier 1.1 execute indirect support with incrementing constant (which it does for all hardware going back to Pascal). I assume AMD and Intel will catch up at some point.
Sampler Feedback
Those of you who were around for the launch of Nvidia’s RTX 2000 series (AKA Turing) might remember some of their claims of support for “texture-space shading”. That sure sounded really cool, but it turns what they actually had was sampler feedback. Basically this is a feature that lets you figure out which texels (within some granularity) were accessed given a UV and texture description. This gives you some rather precise data that you could use as part of feedback system to determine residency for a sparse virtual texture (or which texels you should shade for texture-space shading).
The big downside is that the API is pretty complicated. You have to setup a resource for storing the initial opaque feedback data, you have to bind an extra descriptor, you have to add the feedback generation to the shader, you have to “resolve” the feedback data into a readable format, and then finally you have to copy back to the CPU if you’re going to read it there. After all of that, you can access your info about which regions were sampled. In my experience it’s a lot more unwieldy than simply doing an atomic write from your shader, and it’s also more expensive. So I probably wouldn’t recommend it unless you need very exact feedback.
Nvidia supports this for Turing or newer, while AMD supports it for RDNA2+. Intel supports it for Xe or newer.
Tight Resource Alignment
From the start, D3D12 made the decision to impose fixed alignment requirements for resources. This is simpler compared to Vulkan, where alignments are reported by the device properties at runtime. The big downside is that the D3D alignments can be much larger in some cases, which leads to a lot of waste. In particular the dreaded D3D12_DEFAULT_RESOURCE_PLACEMENT_ALIGNMENT is 64 KB for buffers, which can quickly bloat memory usage if creating many placed resources for tiny buffers.
With “tight placed resource alignment”, you can now pass a new D3D12_RESOURCE_FLAG_USE_TIGHT_ALIGNMENT flag that supports much smaller alignment values. For buffers the range is now 8 to 256 bytes, while textures have 8 byte to 64 KB alignment for non-MSAA (8B to 4 MB for MSAA). This makes small placed buffer resources much more practical.
As of writing, this feature is still in preview and is only available in the 1.716.1 preview Agility SDK.
Render Passes
If your target GPU is a tiler, then you really want render passes. These replace calls to OMSetRenderTargets with pairs of BeginRenderPass and EndRenderPass calls. Importantly, BeginRenderPass takes a bunch of flags that indicate the apps expectations about the lifetime of the render target data as well as whether previous data should be preserved. These flags allow tilers (like the one in Qualcomm’s Adreno line) to make optimal decisions about how to handle on-chip memory, and allow them to potentially skip loading data in and out of on-chip memory which consumes considerable bandwidth.
Enhanced Barriers
D3D12 and Vulkan ended up diverging quite a bit in how they initially exposed barriers in their respective APIs. D3D12 opted for a “resource state” abstraction, where barriers would indicate “transitions” from one state to another which the driver could use to infer which steps are required for ensuring proper data visibility and synchronization. Vulkan opted for a more explicit approach where the thread synchronization, cache flush requirements, and texture data transformations were all represented as separate pairs of before/after access points.
While it was perhaps an interesting idea, D3D12’s approach ended up being rather confusing and suboptimal in practice. Representing every visibility change as a transition gave some programmers the wrong mental model of what GPUs were actually doing under the hood, and in other cases the drivers were forced to insert excess flushes to ensure safety. By far the worst part was the concept of resource state “promotion” and “decay”. The underlying concept is actually fairly simple if you look at it from hardware level: when you submit a batch of command lists through ExecuteCommandLists, the runtime enforces an implicit synchronization and cache flush after that batch finishes. This means there’s no need to synchronize because of a dependency that spans multiple ECL batches: there was already a global sync/flush after the first ECL batch, so no need to do it again. There’s no implicit layout changes for textures since that can’t be done without knowing the future usage of the texture, so that still needs to be done with barriers as usual. The problem is that exposing this implicit sync through the legacy barrier system was awkward and messy: it simply doesn’t map cleanly to an abstraction that uses “resource states” for everything. This is why the documentation around implicit promotion and decay is so convoluted: it has to somehow describe how certain implicit state transitions are allowed in certain situations, while excluding anything that would cause a layout change for textures.
Enhanced Barriers essentially takes the Vulkan approach, where you have sync, flush, and layout options as part of the barrier. This is perhaps more initially challenging to wrap your head around as a beginner compared to legacy barriers, but in the long run it ends up being much simpler IMO. The implicit sync/flushes from ECL batches is now very easy to account for with Enhanced Barriers: you can skip any barriers that would only do one of those things if the dependency crosses ECL batches, but you still have to issue layout transition barriers. There’s also a few more benefits spelled out in the Enhanced Barrier spec, such as avoiding cases where previously the driver would require an additional flush. You can also now discard a resource as part of the barrier, which is another very welcome convenience that can save you additional commands and barriers.
Ray Tracing
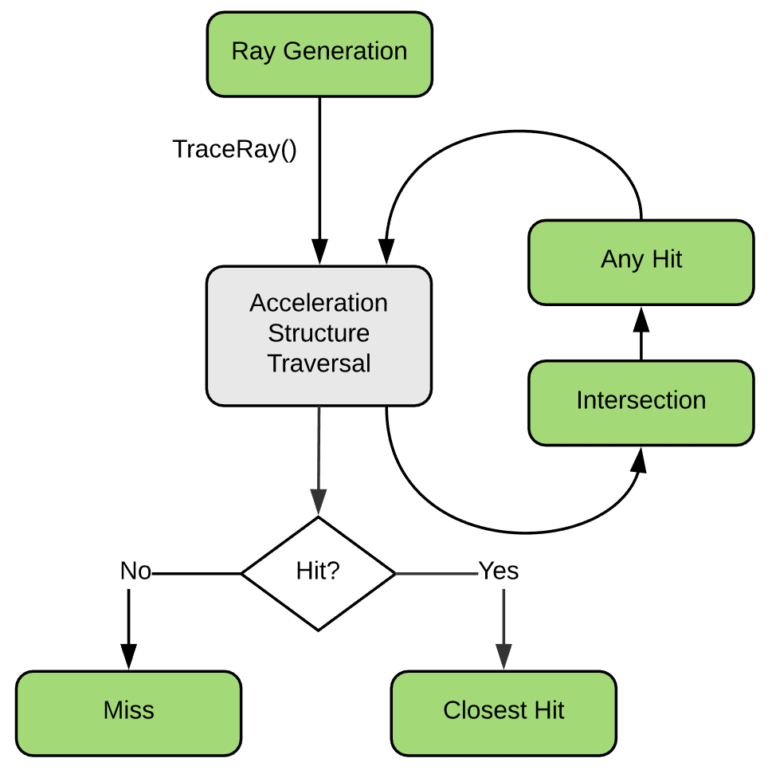
I imagine I hardly need to explain DXR here, as this is perhaps the most marketed and well-known addition to D3D12. In case you’ve somehow missed all of that, DXR brings hardware ray tracing support to D3D12. It’s exposed in two ways:
- The DXR 1.0
DispatchRayspipeline, where you get a very structured setup of providing RayGen, ClosestHit, Miss, AnyHit, or Intersection shaders as part of a big “RTPSO”. With this setup you trace rays from your RayGen shader (which is like a very simplified compute shader), and then based on what that ray hits (or doesn’t hit) the GPU will automatically invoke the right shader for you. - The DXR 1.1
RayQuerypipeline, also known as “inline tracing”, which much more directly exposes the hardware ray tracing functionality to existing shader types. With this setup there’s no “RTPSO” or “shader tables”, you just issue the query as part of a loop and then get the intersection info. From there it’s completely up to you what you do in response to a hit, and there’s no automatic calling of hit shaders or anything like that.
For either approach you need to build an “acceleration structure” for your scene, which contains the BVH or whatever format the hardware is using to accelerate ray/triangle intersections. These AS builds happen on the GPU, and you have to initiate them by providing a list of meshes along with pointers to their position and index data. These “bottom level acceleration structures” (BLAS) can then be instanced into a “top level acceleration structure” (TLAS), which can allow you to replicate the same mesh or meshes in multiple locations without duplicating the memory. You can also move meshes around by only rebuilding the simpler TLAS rather than having to fully rebuild the BLAS. Animated/deformable meshes are much trickier though…these need to have their BLAS constantly rebuilt as the positions move from frame to frame. For these you have the option of doing a more expensive BLAS rebuild, or doing a cheaper BLAS refit that reuses the same BVH tree structure. For the latter you need to be careful though, as the quality of the tree can become worse with more refits if the vertex positions drift too far from the original positions that were used for building the BLAS. If this happens, ray traces will take longer against that mesh since more traversal steps will be needed. In such cases it can be helpful to periodically perform a full rebuild of the BLAS after N refits. In practice there’s quite a few trade-offs that you can make regarding AS build time, trace performance, and memory consumption.
A future DXR 1.2 update is going to add Shader Execution Reordering, which allows some GPUs to re-sort and re-pack waves based on some user-provided sort key. The intention there is that you can reduce divergence for hit shading by re-packing your waves based on a material ID or similar, and that way you end up with more complete waves executing a single shader path.
DXR is fully supported on AMD RDNA2 or newer, Nvidia Turing or newer, and Intel Xe-HPG or newer. Nvidia does also support the more limited Tier 1 on certain Pascal GPUs, which only supports DXR 1.0-style RayGen tracing and not RayQuery/inline tracing. This hardware actually has no build-in hardware acceleration for ray tracing, so personally I wouldn’t recommend bothering with that unless it’s your only option.
Mesh Shaders
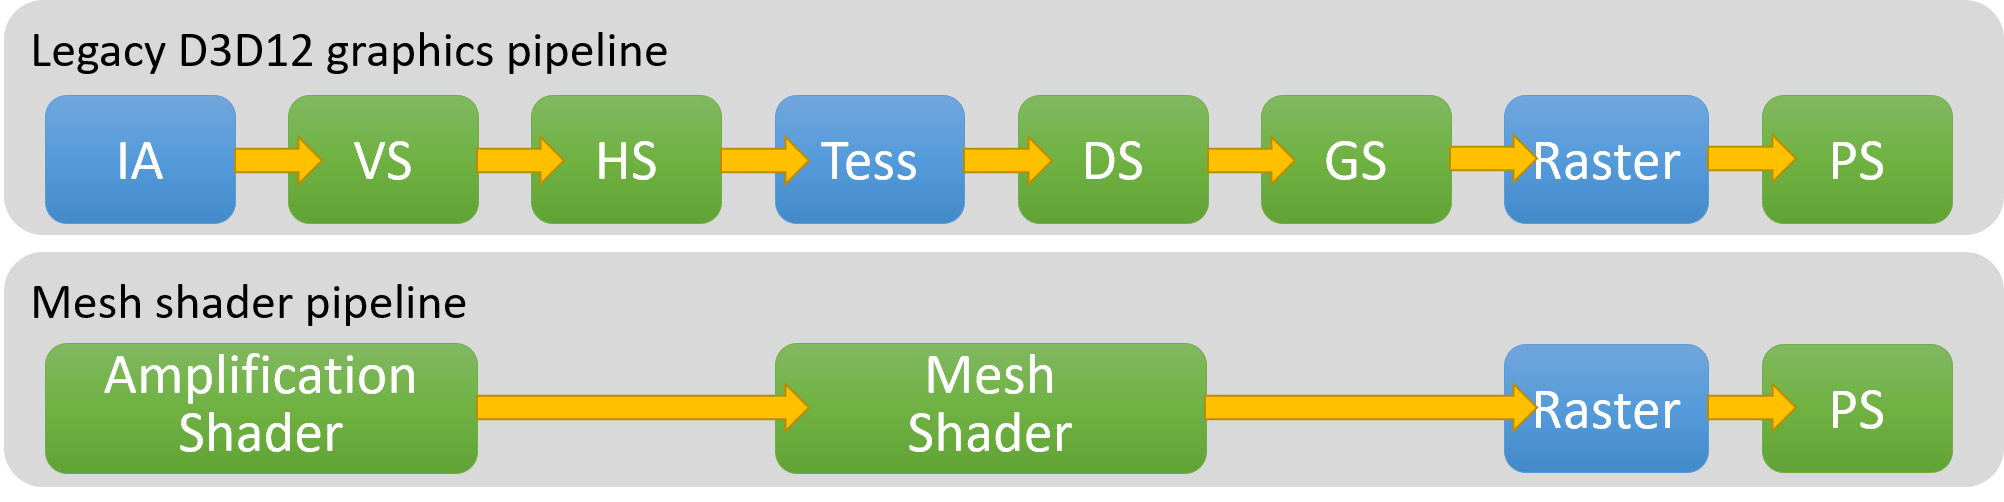
Mesh Shaders are another well-known addition that originally came from Nvidia’s Turing architecture. Mesh Shaders actually have two separate parts: the Mesh Shader, and the Amplification Shader. The latter is optional, so we’ll talk about the Mesh Shader first.
When you use Mesh Shaders, you no longer use the well-known Vertex Shader, Hull Shader, Domain Shader, or Geometry Shader phases for processing your vertices prior to rasterization. Instead, Mesh Shaders expose a more compute-like setup where you have a thread group that produces a batch of vertices and local indices that together form a batch of triangles. The main thing you gain is significant flexibility: there’s no longer any fixed-function index buffers or fixed-function vertex fetch, it’s completely up to your code to decide how to produce the batch of triangles. Since you’re working with a thread group that can make use of groupshared memory, you can also coordinate between threads in a group to work together to produce the output data. This allows for interesting possibilities of procedurally generating geometry, calculating per-triangle data, or de-compressing vertex data.
The typical way that Mesh Shaders get used is for meshlets, also known as clusters. Basically you split your meshes into chunks of up to N vertices and M triangles (say 64 vertices and 128 triangles), and you can then cull those meshlets individually to get fine-grained culling. These map very well to mesh shaders, since you can have one thread group for each meshlet. Inside of a mesh shader it’s then possible to do things like de-compressing the quantized and normalized vertex data based on the meshlet bounds. Or you can even cull at the individual triangle level if you want to, and only output the triangles and vertices that pass culling. Care is needed though when generating meshlets and writing the mesh shader. With mesh shaders you forego any automatic “caching” of vertex shader outputs, and it’s up to you to reduce duplicate vertex loads and transformations by minimizing the number of “shared” vertices between meshlets. Different GPUs also have different performance characteristics around vertex/triangle output counts for mesh shaders, or culling individual triangles.
Amplification Shaders are the other half of what you get with Mesh Shaders. As I mentioned these are optional, as you can invoke Mesh Shader groups directly if you’d like. If you have an Amplification Shader, this is an additional shader stage that runs right before the Mesh Shader phase. Amplification Shaders are also compute-like in that they are dispatched as thread groups, but their special ability is that they can dispatch Mesh Shader groups from the shader with DispatchMesh(). When you do this you pass a payload along, which the Mesh Shader can then use to figure out which meshlet (or similar) needs to be process. The natural use case is to do culling and/or LOD selection right in the Amplification Shader, and then only dispatch mesh shader groups for meshlets that pass culling. This can be super convenient since you don’t need to setup separate compute shader dispatches, output buffers, or indirect arguments: it all happens right in the graphics pipeline. On some hardware this may also provide some benefits in terms of keeping more of the data “on-chip”. But on the other hand, for other hardware it might be a less optimal than doing a compute + indirect dispatch approach since the latter may do a better job of completely filling large GPUs with work. In particular AMD can struggle with Amplification Shaders that cull too much (or Mesh Shaders that don’t do much work), since they use a ring buffer through the command processor that can fill up.
Work Graphs
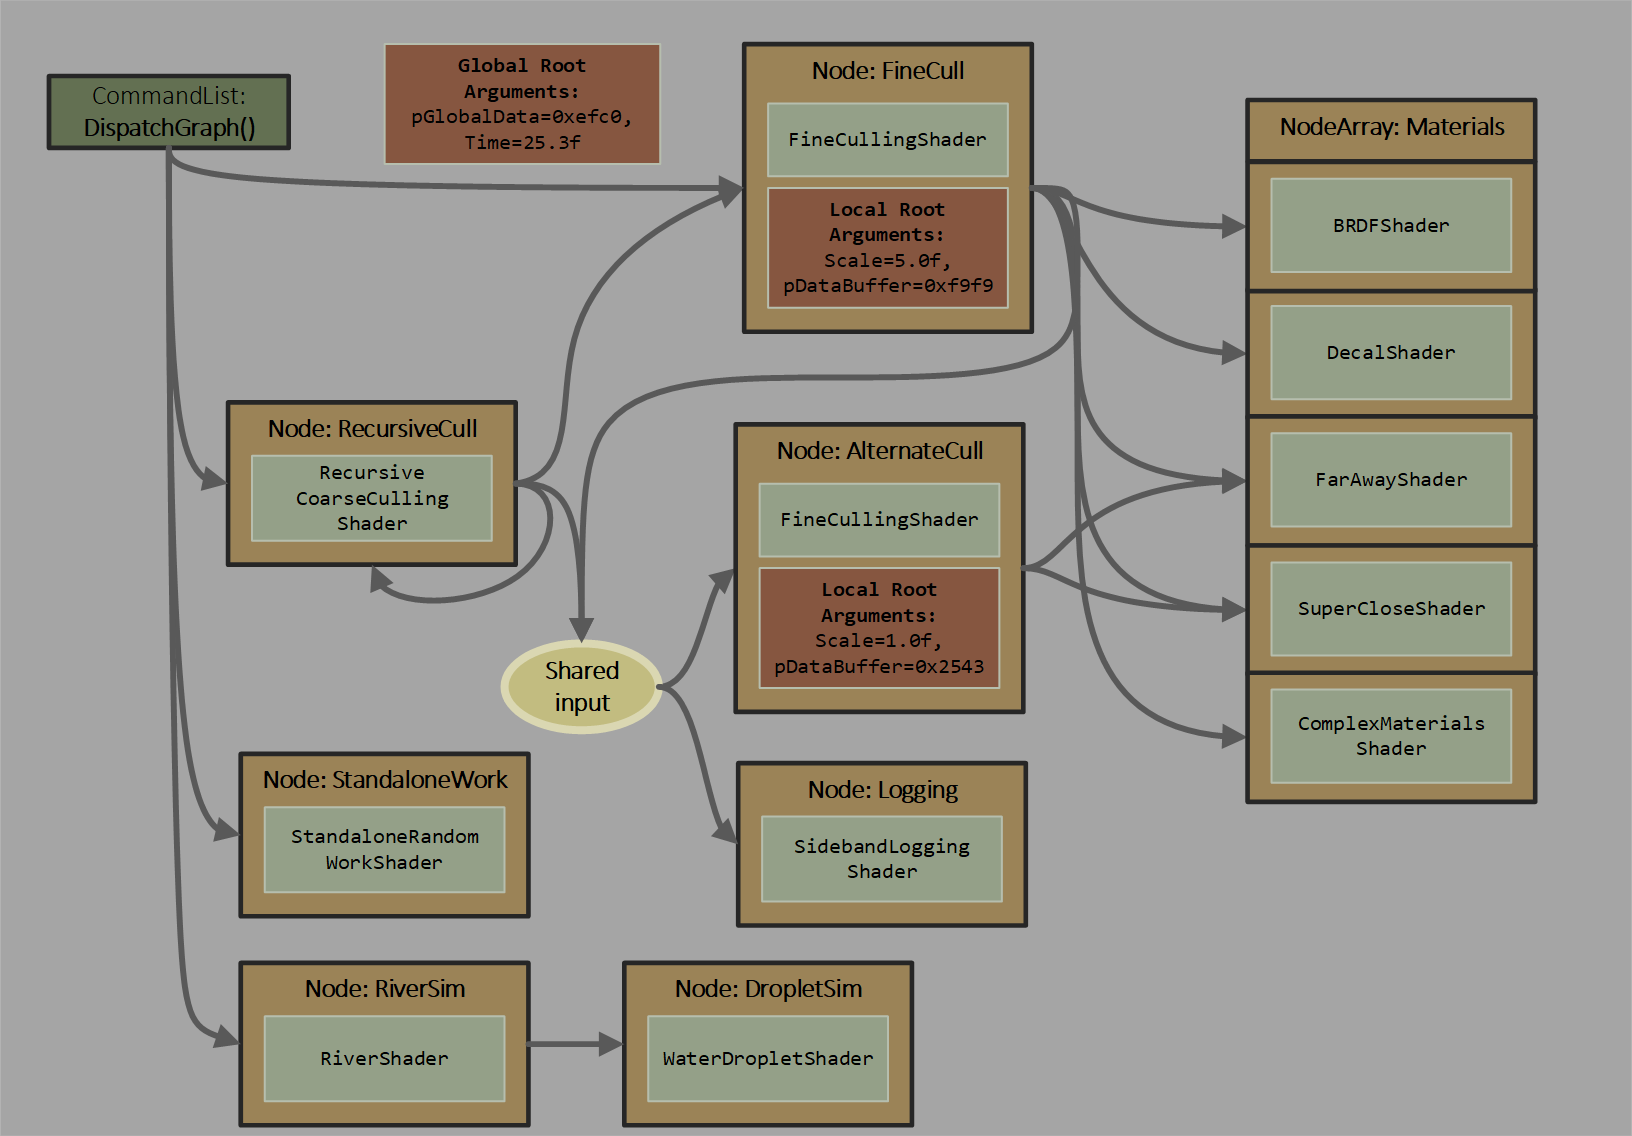
Work Graphs are another rather new and well-publicized addition to D3D12. They’re also a bit complicated, but I’ll try to give a very brief overview. In short, Work Graphs are a new paradigm for having the GPU feed work to itself. Rather than relying on ExecuteIndirect, you can setup a graph of compute nodes where one node can launch groups of threads for another node that it’s connected to. So for example you might have a node that classifies a tile of pixels, and then it chooses one of N specialized nodes based on that classification. The first node can then launch a grid of threads using that selected node, effectively choosing the appropriate shader to use on-the-fly without any intermediate steps. There are definitely some limitations…in particular the topology of the graph has to be statically known when building the PSO before executing a graph. There’s is also no recursion allowed across groups of nodes, you can only recurse into the same node. But it’s still quite flexible and powerful compared with the traditional way of launching indirect dispatches.
Since Work Graphs are quite new, there’s still multiple big question marks around them. In particular, performance. On the RDNA3 hardware that launched Work Graphs, it was definitely quite easy to create simple graphs that were handily outperformed by an ExecuteIndirect equivalent. However AMD has also provided some more complex counterexamples where they were able to (modestly) beat the performance of ExecuteIndirect while also using far less memory. With performance improvements not being guaranteed, it’s harder to judge if Work Graphs will truly take off as the future way of scheduling GPU-driven compute. It’s something you sort-of need to go all-in on if you’re going to get the benefits, and it’s not clear yet if the benefits justify such a drastic change.
Work Graphs also have preview support for mesh nodes, which are essentially just Mesh Shader thread groups. This means you can directly create triangles and rasterize them from a Work Graph, which potentially allows building a GPU-driven mesh pipeline within a single large graph. This mesh nodes feature has yet to be released at the time of writing, and is available in the 1.715.0 or newer preview Agility SDK.
Currently, Work Graphs are supported on RDNA3 or newer for AMD, and Ampere or newer for Nvidia. Intel has no support across their product line.
New Shader Features
Wave Ops
Wave operations are a powerful and difficult-to-use addition to HLSL that came along when DXC/DXIL was first released. These intrinsics allow for simple communication between threads within a “wave” (also known as a warp, wavefront, or subgroup), which can be much faster and simpler than communicating through groupshared or global memory. The simplest of these are the broadcast operations, which allow one thread to see the value of a variable in a particular neighboring thread. The two intrinsics that can do this are WaveReadLaneFirst and WaveReadLaneAt, the latter of which allows you to specify the index of the thread/lane from which the value will be broadcast. Another common operation is the “ballot” (WaveActiveBallot) operation, which gives you a bitmask indicating if a condition is true or false across the entire wave. This can then be used to build higher level operations to determine if a condition is true for all threads in the wave, or if it’s true for any thread in the wave. These two operations are conveniently exposed as WaveActiveAllTrue and WaveActiveAnyTrue, and can be useful for crafting branches that never have divergence. Finally, there’s the reduction and scan intrinsics. The reductions, such as WaveActiveSum, perform some mathematical operation across all threads in the wave and return the result. Whereas the scan intrinsics, such as WavePrefixCountBits, will perform a prefix sum or prefix product across the wave and leave each thread with the cumulative result up to that lane.
Wave operations are part of many interesting low-level optimizations, such as scalarization. However they have to be used with considerable care to not produce undefined results. Wave sizes vary across different hardware vendors, or even across different shaders on the same hardware. It’s very very easy to write some wave-aware code that happens to work on the one wave size you’ve tested, but breaks badly on a different wave size. In general the HLSL language was also designed around the idea of threads being completely independent, and wave operations completely break those assumptions in similar ways to groupshared memory. This again makes it very easy to introduce undefined behavior, particularly when it comes to branching and inactive lanes.
AMD hardware exclusively used Wave64 up through Vega, but all RDNA+ GPUs support both Wave32 and Wave64. Nvidia exclusively supports Wave32 across its entire product line. Intel historically has been quite different with their wave sizes, and has used some combination of 8, 16, and 32-sized waves depending on the architecture.
Quad Ops
Quad operations are very similar to wave operations, except that they operate on the 4 pixel shader threads that form 2x2 quads during rasterization. A lot of these quad operations could already be done in earlier versions of HLSL through clever usage of ddx_fine() and ddy_fine(), but the quad operations make things a lot simpler. In particular you can pretty easily implement a quad overshading visualizer using a few quad operations combined with the input coverage mask.
16-bit floats and integers
DXC and Shader Model 6.2 (re-)introduced lower-precision types and math operations to HLSL. In particular, 16-bit float, integer, and unsigned integer types. If nothing else, these are great for packing data more tightly into buffers without having to write manual conversion and bit-packing code. But if used carefully, it’s possible to get improved ALU throughput and/or reduced register usage for a shader. However this is pretty tricky to pull off in practice when retrofitting existing code, since it’s very easy to accidentally introduce hidden implicit conversions between fp16 and fp32. Additionally, some hardware (AMD notably) can only achieve higher math throughput through use of “packed” instructions that perform the same fp16 math operation on two independent sets of inputs and outputs.
16-bit types are supported on AMD Vega or newer, Nvidia Turing or newer, and all DX12-capable Intel GPUs.
Barycentrics
Barycentrics are essentially coordinates on the surface of the triangle that can be used to interpolate the per-vertex attributes from the 3 triangle vertices. Most modern hardware does this interpolation with some degree of software at the beginning of the pixel shader, and thus they can expose the barycentrics used for this purpose to the shader author. This allows you to implement your own interpolation if you wish, potentially compressing and packing the attributes more compactly than they otherwise would be if using automatic interpolation. In addition, you can also do neat things like anti-aliased wireframe rendering directly in the pixel shader without requiring an additional pass (or a dreaded geometry shader!)
Barycentrics are supported on AMD RDNA 2 or newer, Nvidia Turing or newer, and Intel Xe2 or newer.
Shader Libraries & Linking
The HLSL lib_6_x profile for compiling shader libraries was originally added as part of Shader Model 6.3 for use with ray tracing state objects. While it’s not a well-advertised feature, they can also be used for general offline shader linking of standard graphics and compute shaders. Basically you compile your libraries first with the entry points tagged with the appropriate shader stage attribute, and then you can use DXC to link the entry point with functions defined in a library. It seems DXC then optimizes across the link boundary, so in theory it shouldn’t result in worse DXIL codegen compared to compiling without linking. This makes it a potentially useful option for reducing compilation times.
Helper Lane Detection And Control
Helper lanes are special pixel shader threads that are spawned in order to “fill out” missing entries from the 2x2 quads that pixel shaders are launched in. These lanes do not produce any kind of output, but still perform the usual calculations alongside its neighbors so that derivative operations work correctly when differencing across the quad. The standard way to get these is at triangle edges: all pixel shader threads within a quad have to belong to the same triangle, and so a partially-covered quad will have helper lanes spawned to fill out the quad (even if that pixel isn’t covered by any triangle). However it can also happen dynamically during the execution of a pixel shader. In particular a discard will “demote” a pixel shader thread to a helper, so that the remaining “alive” threads in the wave can continue calculating derivatives and sampling textures as usual. In either case, the IsHelperLane() intrinisic can be used to identify these threads and perform special case logic in the presence of them.
Dynamic Resources (ResourceDescriptorHeap)
The first release of D3D12 supported bindless resources, but you had to do so with some somewhat clunky usage of unbounded resource arrays in HLSL combined with some root signature boilerplate. On top of that you also had to make sure you bound your “one big descriptor table” to the root signature on each command list every time you changed the root signature. Shader model 6.6 and dynamic resources makes all of that go away. Instead you just get a magic ResourceDescriptorHeap array that you can access from anywhere, and it gives you the resource that lives at the provided index of the bound descriptor heap. With this you can drop nearly everything from your root signature if you want, and instead just provide a few root constants or root CBVs/SRVs that the shader can use to grab whatever descriptor indices it needs. While not technically required for bindless, it makes things much much simpler and nicer. This is particularly true for StructuredBuffer, which in the old way required you to declare a separate unbounded resource array for every possible struct type that you used as an element.
To go along with ResourceDescriptorHeap, there’s also SamplerDescriptorHeap which works exactly the same except for the sampler descriptor heap. This makes bindless samplers just as simple if that’s what you need.
WaveSize
As I mentioned earlier, wave ops are really tough to use effectively in a way that works across all possible wave sizes. This is especially true since the wave size is not known at compile time, so any logic for separate wave sizes would have to expressed as conditionals on WaveGetLaneCount(). The [WaveSize(N)] intrinsic from Shader Model 6.6 aims to help here by allowing compute shader to specify that can only work with the specified wave size. This is enforced at runtime, where PSO creation will fail if the wave size is not supported by the current device and driver. While this helps, the situation is still tricky since you will want to compile the same shader N times for each possible wave size you want to support. You also likely want to have some sort of fall back that doesn’t use wave operations if you don’t support every possible wave size that D3D allows.
Derivatives In Compute
Traditionally quads were something that only existed in pixel shaders, which meant that by extension pixel shaders were the only stage that could use derivative intrinsics or texture sampling functions with implicit LOD mip level selection. This Shader Model 6.6 feature brings quads to compute shaders as well, by specifying some rules about how certain threads within the thread group end up getting mapped to quad indices. If you carefully respect these rules when writing your shader, you can then use the regular Texture2D.Sample function to get mip selection without having to pass gradients or calculate the mip level yourself. Note that this spec still does not fully specify how threads get mapped to waves within a thread group, so care must be taken not to make assumptions about waves are arranged in compute.
64-Bit Atomics and Atomic CAS For Floats
Prior to this feature, atomic operations could only be performed on 32-bit integers. Shader Model 6.6 changes this, and now allows you to perform atomics on 64-bit integers in buffers and textures. This is surely handy if you’re going to the nanite route of software rasterizing into a visibility buffer. In addition, SM 6.6 adds very limited support for atomics on fp32 values. In particular, it introduces InterlockedCompareStoreFloatBitwise and InterlockedCompareExchangeFloatBitwise. These essentially treat the float bits as a uint32_t, and perform a regular atomic CAS.
Raw Texture Gather
Raw Texture Gather is an interesting Shader Model 6.7 feature that allows you to perform a 4-texel gather on certain integer texture formats. If you have a R16_UINT, R32_UINT or R32G32_UINT format texture, you can gather a 2x2 quad of texels and have them returned to the shader as raw unfiltered bytes. This bypasses previous restrictions on using Gather with an integer texture format.
Writable MSAA Textures
As the same suggests, this Shader Model 6.7 features allows shaders to directly write to MSAA textures through the new RWTexture2DMS and RWTexture2DMSArray HLSL resource types. Previously you could only write to them through a render target view, or through copy/resolve operations.
SampleCmpLevel
SampleCmpLevel is like SampleCmpLevelZero, except that it lets you pass a specific mip level instead of only being able to sample the 0th mip level.
ByteAddressBuffer Types Load and Store
This is not a shader model feature, but just something that DXC now supports at the language level. Instead of only being able to load a uint/2/3/4 from a ByteAddressBuffer, there’s now a templated Load<T> method that allows you to load any arbitrary type or struct at an offset (with 4-byte alignment, or 2-byte alignment if 16-bit types are supported). There’s also a matching Store<T> function on RWByteAddressBuffer that works the same way, except for storing. To accompany these new methods, DXC also added support for sizeof(). This allows you to load from arrays of arbitrary types, similar to StructuredBuffer:
MyStruct s = byteAddressBuffer.Load<MyStruct>(index * sizeof(MyStruct));
SV_StartVertexLocation + SV_StartInstanceLocation
Many people are caught off guard when they find out that the BaseVertexLocation and StartInstanceLocation parameters of DrawIndexedInstanced do not affect the SV_VertexID and SV_InstanceID system value inputs for the vertex shader. Instead, they only affect fixed-function vertex fetch that occurs in the input assembler. This is especially confusing since GL and Vulkan have not worked this way, and have mechanisms to provide the vertex and instance offsets to the vertex shader. This new feature closes the gap by providing new SV_StartVertexLocation and SV_StartInstanceLocation system value inputs that contain the value of the BaseVertexLocation and StartInstanceLocation parameters. This can be particularly useful with GPU-driven rendering pipelines that make use of ExecuteIndirect, since it provides additional way to pass data along to the resulting draw.
Enums
Weirdly, HLSL never supported C-style enums until DXC added support for HLSL 2017. Now you can do the usual enum and enum class declarations, just like you would in C++.
Templates
HLSL 2021 added limited support for template types and functions to HLSL. This is obviously a major change with huge implications on how the language is authored, both good and bad. However it is unquestionably powerful and flexible, allowing pure templated HLSL code to be used in many places where either macros or code duplication had to be used previously. For example you could make wrappers around bindless resource descriptors, or go nuts and make templated spherical harmonics math libraries. Just be sure to watch out for compile times and inscrutable compilation errors.
Operator Overloading
Along with templates, HLSL 2021 allows for overloading a limited subset of operators for user-defined types. The usual arithmetic, bitwise, comparison, function, and array subscript operators all supported. The main exception are pointer-related operators like * and &, and operators that require returning a reference to this like +=.
Bitfields
Bitfields are often useful for tightly packing lots of data into a limited number of bits, which is something we tend to do a lot on GPUs. With bitfield support, you no longer thave to write manual masking and bit shifting to stuff values into smaller than 16 bits.
C++-Style Function Overloading and For Loop Scoping
One of the weird quirks of HLSL was that it had wacky overload resolution. Rather than overloading purely based on the number and type of the arguments like C++, it would essentially “destructure” custom types into their primitive components and overload based on that. This could be very surprising, to say the least. HLSL 2021 fixes this and uses the usual overload rules that you’re probably used to.
Another odd quirk that was resolved in HLSL 2021 was for loop scoping for anything declared in the for block. Pre-2021, anything inside of the for lived in the parent scope of the loop. This meant that if you had for (uint i = 0; i < length; ++i) { } the i variable would persist after the loop was finished. With HLSL 2021, i would only exist in the loop body instead which is how C++ and C99 handles it.
Developer Workflow Enhancements
Agility SDK + Independent Devices
As you’ve no doubt surmised from reading this far, D3D12 has changed an awful lot since it was first released. However in the early days this changes could be rather slow to roll out, since they had to be tied to major Windows 10 updates. That’s not great for an API that’s constantly evolving, and it’s really not great for developers who need to ensure a minimum available feature set across their potential user base. The Agility SDK aimed to fix both of these issues by decoupling major DX12 releases and additions from the OS release cycle, and instead bundling them into a D3D12Core.dll that could be shipped to end users. The way it works is a bit interesting: rather than an app only using the D3D12Core.dll that it shipped with, the D3D loader will also look at the installed OS version of D3D12Core.dll and use whichever is newer. That way apps can still get bug fixes and updates, but still ensure they have a floor for available features.
The developer story for the Agility SDK was originally a bit clunky. It was easy enough to get a D3D12Core.dll, the debug layer dll, and the corresponding d3d12.h header. You had to be careful with your include paths to make sure you’re including the newer d3d12.h rather than the one from the Windows SDK, but that’s not too hard to do. However the really annoying part was setting up the “magic” exports on your exe that let the D3D loader know that you want to use an Agility SDK. These required exporting a string containing a relative path to where D3D12Core.dll could be found, as well as an integer representing the intended Agility SDK version. This is a bit annoying for packaging as well as development builds…for various reasons you didn’t want D3D12Core.dll to live in the same folder as your executable, and so you had to place it in a known subfolder relative to the executable. However the real dealbreaker was for app plugins that wanted to use a D3D12 device. Since the “magic” exports have to be on the executable, there’s no way for a plugin to specify the Agility SDK that it wants. So it’s stuck with whatever the base app specifies…which is likely no Agility SDK at all. The Independent Devices feature fixes both of these problems by providing an API that can specify the Agility SDK details. Doing this required D3D12 to change its “one device per process” rule that it used previously, which is why the feature is called “Independent Devices”.
Debug Layer Callback
The debug layer is obviously super valuable and useful for catching programmer mistakes and undefined behavior before it happens. It also has a handy feature where you can instruct the layer to break into the debugger when an error occurs, which makes it more useful for catching the line of code that actually generated the error. However the error message itself was always output to the debugger output stream, which is displayed in Visual Studio but is otherwise very hard to interpret yourself. This could be especially frustrating if you come from Vulkan, where the validation layer allows you to install a callback that gets passed the details of the error right when it’s generated. D3D12 finally caught up with the release of Windows 11, which adds a new API that allows you to install a callback that gets called whenever the debug layer generates a message. You can then assert, print, log, etc. however you wish.
Device Removed Extended Data (DRED)
Overall the story for debugging and resolving GPU crashes is pretty terrible on PC. When it happens, you’re often on the other side of multiple abstractions and black boxes which makes it very very difficult to find the root cause. DRED aims to help a bit with this near-impossible task by providing some information about what the GPU was doing (or rather has already done) when it crashed on you. Basically it uses WriteBufferImmediate to automatically generate “breadcrumbs” for various commands recorded on the command list, such as PIX markers or draw calls. Then when the device is removed, you can use the DRED APIs to dump out the state of each command buffer with an indicator of which breadcrumbs were reached by the GPU. With any luck, this can point you to the particular pass or dispatch that caused the crash. In the case of a page fault DRED can also provide a list of resource debug names that correspond to the page fault address…although in practice I’ve found that this information is often missing for unknown reasons.
What’s Changed For Me Personally
All-In On Bindless and “User-Space Bindings”
Bindless might seem like a fun party trick at first, or something you only use in situations where you truly need to the shader to decide which resources it wants to use. But once you go all-in, it can have a transformative effect on your codebase and the way you work. Even in cases where you know up-front exactly which textures and buffers a shader will need, in my experience it’s an unquestionably nicer experience to do things through bindless rather than using old slot-based APIs or clunkily assembling descriptor tables. This is especially true with SM 6.6 type bindless with ResourceDescriptorHeap. Essentially every resource descriptor you can access just turns into a simple uint32_t that you can put wherever you want. I like to call it “user-space bindings” since that uint32_t is no longer opaque, and doesn’t need to live in a descriptor heap or a descriptor set or some other place where you don’t actually own the memory. You can put in structs, arrays, textures, anything you want.
On the host side of things, the potential for simplification can be enormous. Root signatures in particular can be sidelined almost completely, it’s completely viable to have just a handful or even one global root signature that gets used for everything. All you need to care about in your root signature is how you pass your initial “root” data to a shader, which might be some root constants, root CBVs, or root SRVs. Once you have that, all of your other resources can be accessed by pulling in descriptor indices. With a non-bindless setup you might find yourself doing things like reflecting shaders to generate an “optimal” root signature, or creating many root signatures to handle many different cases of ways that you would organize various resources into descriptor tables that are bucketed by the frequency by which the table bindings change. With bindless, that’s all gone! Root signatures can get stuffed into some corner of your codebase that deals with booting up the D3D12 device, and you may never have to think about it again. My “universal” root signature that I use in my home codebase looks like this, and I create it during startup:
D3D12_ROOT_PARAMETER1 rootParameters[NumUniversalRootSignatureParams] = {};

// Constant buffers
for(uint32 i = 0; i < NumUniversalRootSignatureConstantBuffers; ++i)
{
    rootParameters[URS_ConstantBuffers + i].ParameterType = D3D12_ROOT_PARAMETER_TYPE_CBV;
    rootParameters[URS_ConstantBuffers + i].ShaderVisibility = D3D12_SHADER_VISIBILITY_ALL;
    rootParameters[URS_ConstantBuffers + i].Descriptor.RegisterSpace = 0;
    rootParameters[URS_ConstantBuffers + i].Descriptor.ShaderRegister = i;
    rootParameters[URS_ConstantBuffers + i].Descriptor.Flags = D3D12_ROOT_DESCRIPTOR_FLAG_DATA_STATIC;
}

// AppSettings
rootParameters[URS_AppSettings].ParameterType = D3D12_ROOT_PARAMETER_TYPE_CBV;
rootParameters[URS_AppSettings].ShaderVisibility = D3D12_SHADER_VISIBILITY_ALL;
rootParameters[URS_AppSettings].Descriptor.RegisterSpace = 0;
rootParameters[URS_AppSettings].Descriptor.ShaderRegister = AppSettings::CBufferRegister;
rootParameters[URS_AppSettings].Descriptor.Flags = D3D12_ROOT_DESCRIPTOR_FLAG_DATA_STATIC;

// Static samplers
D3D12_STATIC_SAMPLER_DESC staticSamplers[uint64(SamplerState::NumValues)] = {};
for(uint32 i = 0; i < uint32(SamplerState::NumValues); ++i)
    staticSamplers[i] = GetStaticSamplerState(SamplerState(i), i, 0, D3D12_SHADER_VISIBILITY_ALL);

D3D12_ROOT_SIGNATURE_DESC1 rootSignatureDesc = {};
rootSignatureDesc.NumParameters = ArraySize_(rootParameters);
rootSignatureDesc.pParameters = rootParameters;
rootSignatureDesc.NumStaticSamplers = ArraySize_(staticSamplers);
rootSignatureDesc.pStaticSamplers = staticSamplers;
rootSignatureDesc.Flags = D3D12_ROOT_SIGNATURE_FLAG_CBV_SRV_UAV_HEAP_DIRECTLY_INDEXED;

DX12::CreateRootSignature(&UniversalRootSignature, rootSignatureDesc);
A “bindful” engine might have code that carefully manages the lifetime of descriptor tables, maybe even using hashes or similar to determine whether a table can be re-used or a new table has to be built. And perhaps also you have hooks for your texture streaming or CPU-updated buffers to know when to invalidate your descriptor sets, since the SRV descriptor had to change. Once again, all gone! Poof! You do still need to have a double-buffered descriptor heap and make sure you don’t update descriptors that are still being accessed by the GPU, but that’s straightforward and also something you can likely manage in one centralized place by having a queue of updates. In my home codebase, binding some resources and constants looks like this:
MeshConstants meshConstants =
{
    .World = world,
    .View = camera.ViewMatrix(),
    .WorldViewProjection = world * camera.ViewProjectionMatrix(),
    .CameraPos = camera.Position(),
    .Time = data.ElapsedTime,

    .VertexBuffer = model->VertexBuffer().SRV,
    .MeshletBuffer = model->MeshletBuffer().SRV,
    .MeshletBoundsBuffer = model->MeshletBoundsBuffer().SRV,
    .MeshletVerticesBuffer = model->MeshletVerticesBuffer().SRV,
    .MeshletTrianglesBuffer = model->MeshletTrianglesBuffer().SRV,
};

camera.GetFrustumPlanes(meshConstants.FrustumPlanes);

DX12::BindTempConstantBuffer(cmdList, meshConstants, URS_ConstantBuffers + 0, CmdListMode::Graphics);
It’s dead simple: I init a struct with a bunch of constants as well as SRV descriptor indices, which can live together side-by-side instead of having to be kept separate. Then in BindTempConstantBuffer I grab some temporary frame-lifetime CPU-writable buffer memory, copy in the struct contents, and bind it to the root signature as a root CBV in one go. I could also trivially have nested structures with more descriptor indices if I want, or have this live in a persistent buffer instead of creating one on-the-fly. Either way it’s all something I can control and handle however I want, which is incredibly freeing.
On the shader side it’s perhaps less-transformative, but bindless is still cool. One aspect that can cause some friction at first is that you don’t just have the resources available as globals in HLSL. Instead you explicitly grab the resources using ResourceDescriptorHeap and then do what you want. In the long term though I think this is a very positive change vs. requiring resources to be globals, and can make the code a whole lot cleaner and composable once you lean into it. If you really want you can also load your HLSL resources into static global variables to mimic the old style, but I don’t particularly recommend that unless you’re adapting a large existing codebase. And of course once you have bindless, you can also do very fancy things in your shaders like traversing your own data structures or sampling arbitrary material textures based on a material ID.
For ray tracing in particular bindless is a lifesaver, and a massive simplification over juggling local root signatures and shader binding tables. In fact I wrote a whole chapter about that in Ray Tracing Gems II!
The main downside with “bindless everywhere” tends to be in tooling and introspection. When bindings are known statically at draw/dispatch time, it’s trivial for tools like RenderDoc and PIX to intercept those bindings and display them for you later when you’re viewing a capture. On a similar note, validation layers also have a much easier time with old-style bindings since they need to know which resources a particular operation accessed. With bindless there’s no way to know which resources actually got accessed without running the shader, which is basically what these tools now have to do if you want accurate information. They will patch your shader bytecode to insert new instructions that can store out introspection data to a buffer, and then gather that data after running your draw or dispatch to know which resources got accessed. This does actually work, but adds significant complexity on the tooling side that didn’t exist previously. On a similar note shader reflection APIs can also be rendered nearly useless for determining which resources a shader uses, so you may need a new approach if you’re relying on that information.
HLSL Templates
Templates always inspire mixed feelings in me. They are undeniably useful and powerful, but come with an endless list of ways they can blow up in your face. Whether it’s bloated compile times, indecipherable error messages, or insane SFINAE gymnastics that cause programmers to consider taking up farming: the potential downsides are numerous and well-documented. But again, undeniably useful. Having carefully introduced templates into my own shader code, I am of the opinion that adding them was the right call and we’re better off having them than not. But I try to be at least as cautious with them as I am with my C++ code, in that I generally reach for simpler lower-tech solutions whenever I can even if it adds a bit of copy/pasted code.
So what have I used them for? The list is pretty long at this point, but here’s some highlights:
- They’re immediately useful for functions that you want to be able to use with both fp32 and fp16 data types. No need to duplicate the function, just write it once. You can also make functions vector-size agnostic, but that’s a little clunkier. For an example of both of these things you can have a look at my SHforHLSL library that implements types and functions for working with low-order spherical harmonics. In fact it’s probably also a good case for trying to figure out what’s “going too far” with templates. In particular I think templating on the monochrome vs RGB variants hurts the readability of the code in some places. For a library where you don’t really touch the code this might be fine, but in more actively-developed code I would probably be annoyed with it. If you compare against the non-templated Lite version, the non-templated code can end up looking a good bit cleaner.
- Similarly, templating on the texture type can be nice for implementing things like filtering functions where the code could easily handle float/float2/float3/float4 types.
- For some code that I’ve worked on, I ended up making an algorithm that used a templated “writer” type. This let me use the same code and have it write its outputs to a buffer, or alternatively have it log its results using a shader printf.
- Speaking of shader printf…my own implementation uses templates for handling the format string as well as packing the arguments into the debug buffer.
- I never actually used this, but I did sketch out a proof-of-concept for a buffer wrapper that could emulate Buffer Device Address functionality that you have in Vulkan. It’s pretty clunky compared to actual language support for such a thing, but it’s nice that you can do it.
Just as with C++ I think templates are potentially a liability, and it’s very easy to over-use them. But at the same time I still think they have be a large net positive if used judiciously. There’s definitely room for very reasonable arguments that HLSL should have chosen a different direction here instead of following C++…Slang’s generics are probably the most usable counter-example at the moment. Personally I’m generally a pragmatist and think there’s a large value in using existing paradigms that are well-understood, and I’m not sure if Slang’s divergence is a win in the long run. But time will tell, and I’ll definitely pay attention to what happens in that space!
More Code Sharing Between HLSL and C++
A lot of engines invest considerable amounts of engineering and code into trying to automatically manage the boundaries between C++ and shader code. These tend to be some combination of shader reflection, code generation, and/or runtime layers that make it possible for engine code to provide the data and bindings that the shader needs. This can be a rather useful investment: it allows engines to hide specific details of how bindings work, or even transparently account for wacky HLSL constant buffer alignment rules. But this can be a double-edged sword: it can result in esoteric peculiarities specific to an engine, and can require considerable maintenance to keep such layers working through new features and/or APIs.
Lately I find myself drawn to the much simpler option of simply sharing structs, functions, and other code between my HLSL and C++ where it makes sense. This is helped along a bit by the latest HLSL language features, where it’s now fine to use enums, templates, and methods as much as you’d like. But in particular, using bindless for everything makes it even more viable. Like I mentioned earlier, with bindless you can effectively represent any resource descriptor as 32-bit integer or handle that you store freely in structs. This means you can trivially store all of a shader’s various constants and resources in one more structs that you share between C++ and HLSL, and both C++ and HLSL will also stay up-to-date without the need for codegen or reflection. One major wrinkle here is constant buffers, which unfortunately after 10 years of D3D12 still have the annoying legacy packing rules for vectors and arrays. For such cases you would have to manually account for alignment issues, or ignore constant buffers altogether. Fortunately the latter approach is increasingly viable on modern hardware.
In reality this “just share” approach is probably going to be more viable for simpler scenarios. Larger engines will likely have more complex binding mechanisms to deal with, and may have to deal with weird platforms where sharing is less viable. So it’s certainly not a panacea, but I do think it’s increasingly becoming a worthwhile option.
Designated Initializers
This is not strictly related to graphics or APIs, but I do rather like designated initializers in C++20. They’re nicer than having to set struct members one at a time, and they have less compiler + non-optimized runtime overhead than “builder” patterns that use method chaining. I generally like to pair them with structs that have default values specified through member initializers, and then the designated initializers can “override” the default value. With this pattern you can even emulate named arguments, which can be much easier to read than a soup of parameters. For example:
struct RawBufferInit
{
    uint64_t NumElements = 0;
    bool32 CreateUAV = false;
    bool32 Dynamic = false;
    bool32 CPUAccessible = false;
    const void* InitData = nullptr;
    ID3D12Heap* Heap = nullptr;
    uint64_t HeapOffset = 0;
    const char* Name = nullptr;
};

spotLightClusterBuffer.Initialize({
    .NumElements = numXYZTiles * AppSettings::SpotLightElementsPerCluster,
    .CreateUAV = true,
    .Name = "Spot Light Cluster Buffer",
});
In my experience this is great for resource initialization, and also for barriers. I like to have helpers that set you up for common barrier situations, and then use designated initializers to override the specifics:
struct DepthWritableBarrierDesc
{
    bool FirstAccess = false;
    bool Discard = false;
    D3D12_BARRIER_SYNC SyncBefore = D3D12_BARRIER_SYNC_ALL_SHADING;
    D3D12_BARRIER_ACCESS AccessBefore = D3D12_BARRIER_ACCESS_SHADER_RESOURCE;
    D3D12_BARRIER_LAYOUT LayoutBefore = D3D12_BARRIER_LAYOUT_DIRECT_QUEUE_SHADER_RESOURCE;
    uint32_t StartArraySlice = 0;
    uint32_t NumArraySlices = uint32_t(-1);
};

DX12::Barrier(cmdList, depthBuffer.DepthWritableBarrier({ .FirstAccess = true }));
This is where I now get on my soapbox to rant about the specific implementation of designated initializers in C++, which requires that the order of your initializer match the order in which the members are declared. It’s setup this way to avoid nasty footguns where the initialization/construction of one member depends on another member…but it’s deeply unfortunate that this particular edge case hurts the usability of the feature for the common 99% of cases where you don’t really care about the init order. Clang does at least have a way to demote this into a warning, but MSVC does not as far as I’m aware.
Printf and Other Shader Debug Features
Once again this is not something that requires the latest D3D and HLSL toys to pull off, but if you are on the latest and greatest it becomes quite a bit easier to do. In particular:
- SM 6.6-style bindless makes it possible to make writable debug buffers globally available to any shader without any modifications for app code. This means if you have shader hot reloading, you can just add some debug printing code to your shader without restarting or recompiling the app. In my own code I achieve this by reserving a particular known index in the descriptor heap for the debug buffer, and hard-code that index into the .hlsli file that shaders include for debug functionality.
- HLSL templates and RWByteAddressBuffer typed stores make it much more convenient to stuff heterogenous data into your debug buffer (useful for things like printf arguments)
- While not an official feature, it’s possible to (ab-)use DXC’s template functionality to work with actual string literals for printf-like functionality, which is much simpler and more natural than the alternatives.
Having a reliable working shader printf can be a game changer, and can almost make you forget how awful the debugging situation is on PC. What I like to do is have some utility functions that allow you to filter the debug functionality down to a particular thread, potentially by filtering output to the thread/pixel under the mouse cursor. Then I will use helper macros that print out the state of local variables, which serves as a sort-of live debugger for a thread. Once you have this setup you can make changes to shader, and continue inspecting the values of the intermediate variables to see the end result of your changes.
Another useful trick that I now get a lot of mileage out of is drawing debug wireframe shapes directly from a shader. The process for this starts out rather similar to shader printf: you have some globally-accessible debug buffer, and your shader functions dump the shape transform + properties into that buffer. Then towards the end of the frame, you perform an indirect draw for each shape to consume the data from the debug buffer and draw the shape to the screen. It takes a bit of plumbing to get it all setup, but once it works it can be incredibly useful for debugging. It can also be a rather convenient way of implementing dev-only debug visualizations that you otherwise would have had to do on the CPU, or with bespoke shaders. For example, if you’re performing culling in your a compute shader you can draw colored bounding spheres to indicate the result of the culling operation.
Here’s an example of using both printf and debug drawing together for debugging a ray generation shader, so you can see what I mean:
ShaderDebug::FilterIfCursorOnPos(pixelCoord);
DebugPrint_("RayGen Pixel XY: {0}", pixelCoord);
DebugPrintVar_(ray.Origin);
DebugPrintVar_(ray.Direction);
DebugPrintVar_(payload.HitT);

float3 arrowColor = payload.Radiance;
arrowColor/= max(max(max(arrowColor.x, arrowColor.y), arrowColor.z), 0.0001f);
float3 arrowEnd = ray.Origin + ray.Direction * payload.HitT;
ShaderDebug::DrawArrow(ray.Origin, arrowEnd, float4(arrowColor, 1.0f));
Conclusion
Thanks for reading this far! Hopefully you got an idea of the scope of things that have changed in D3D12 over the past 10 years, and also found it interesting to read about my own experiences. See you next time!