GPU Profiling in DX11 with Queries
For profiling GPU performance on the PC, there aren’t too many options. AMD’s GPU PerfStudio and Nvidia’s Parallel Nsight can be pretty handy due to their ability to query hardware performance counters and display the data, but they only work on each vendor’s respective hardware. You also might want to integrate some GPU performance numbers into your own internal profiling systems, in which case those tools aren’t going to be of much use.
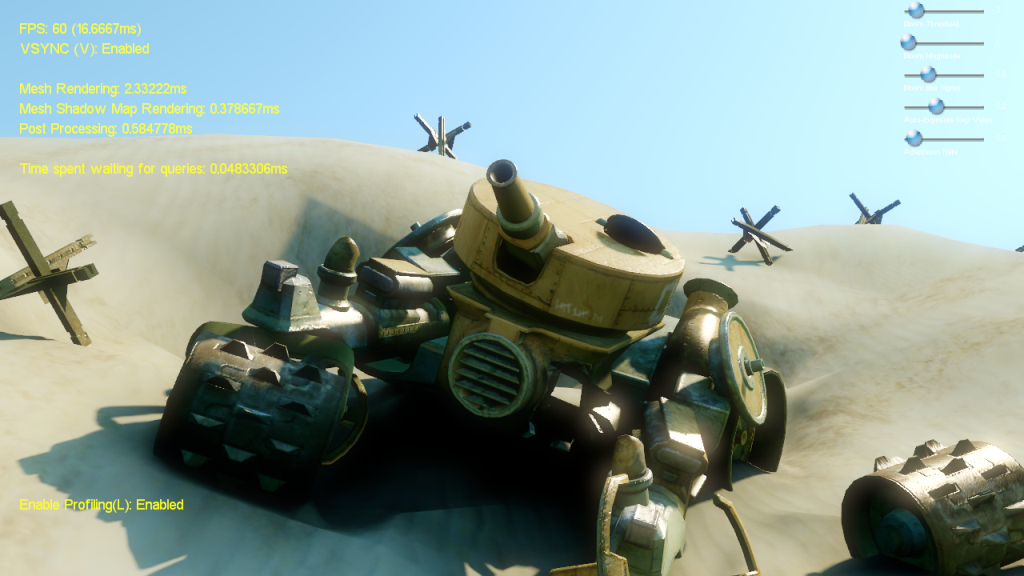
To get around this, it’s possible to use D3D11 timestamp queries to get coarse-grained timing info for different parts of the frame. It’s a ways off from the kind of info you get from the vendor-specific tools, but it’s a lot better than nothing. It’s also pretty easy to implement. To profile a portion of your frame, you need a trio of ID3D11Query objects. Two of them need to have the type D3D11_QUERY_TIMESTAMP, and are used to get the GPU timestamp at the start and end of the block you want to profile. The third needs to have the type D3D11_QUERY_TIMESTAMP_DISJOINT, and it tells you whether your timestamps are invalid as well as the frequency used for converting from ticks to seconds. In practice it goes like this:
When starting a profiling block:
- Call ID3D11DeviceContext::Begin and pass the DISJOINT query
- Call ID3D11DeviceContext::End and pass the start TIMESTAMP query
When ending a profiling block:
- Call ID3D11DeviceContext::End and pass the end TIMESTAMP query
- Call ID3D11DeviceContext::End and pass the DISJOINT query
After waiting a sufficient amount of time for the queries to be ready:
- Call ID3D11DeviceContext::GetData on all 3 queries
- Compute the delta in ticks using the timestamps from both TIMESTAMP queries
- Use the frequency from the DISJOINT query to convert the delta to a time in seconds
Like any query, you need to wait for the GPU to actually execute all of the commands you submitted for the data to be ready. In my sample app, I handle this by keeping an array of queries for each profile block and moving to the next one each frame. Then at the end of the frame, I get the data from the oldest query and use that for outputting the timing data to the screen. So the actual timing data lags behind by a few frames, but that’s okay for real-time profiling. For automated benchmarks or performance snapshots you could either use the data from N frames later, or you could just stall at the end of the frame and wait for the query to be ready.
Sample code and binaries are available on GitHub: https://github.com/TheRealMJP/DX11Samples/releases/tag/v1.2
Comments:
djmips -
What I have been doing is one disjoint query per frame (start and end) and many matched timestamp tokens in the frame. It seems to work fine but sometimes I do get weird values for the disjoint frequency on some older nVidia cards. Is there anything wrong with my approach?
#### [RebelMoogle](http://www.yojimbo.de "chaos.yoji@gmail.com") -
There’s a little snag I hit: I changed the ID3D11Queryptr in the ProfileData struct in the Profiler class to ID3D11Query*, which resulted in not fully initialized arrays, thus containing garbage and breaking the program. If like me, anyone else is to lazy to write a few typedefs, here’s what I did: I have changed the struct constructer to the following: struct ProfileData { ID3D11Query* DisjointQuery[QueryLatency]; ID3D11Query* TimestampStartQuery[QueryLatency]; ID3D11Query* TimestampEndQuery[QueryLatency]; BOOL QueryStarted; BOOL QueryFinished; ProfileData() : QueryStarted(FALSE), QueryFinished(FALSE) { ZeroMemory(DisjointQuery, sizeof(ID3D11Query) * QueryLatency); ZeroMemory(TimestampStartQuery, sizeof(ID3D11Query) * QueryLatency); ZeroMemory(TimestampEndQuery, sizeof(ID3D11Query) * QueryLatency); } }; Other than that it works beautifully. ( I changed the code so that you can just drop it into any program without needing the SampleFramework11, if anyone wants it. :) )
#### [3dcgi](http://3dcgi.com "tmartin@ieee.org") -
I don’t know about Nvidia, but AMD has a perf API that can be integrated into your engine so you can get PerfStudio like counter data without using PerfStudio. http://developer.amd.com/tools/GPUPerfAPI/Pages/default.aspx
#### [Ben]( "forltiko@gmail.com") -
You need a new test scene :)
#### []( "") -
You can also do this with D3D9 btw. NVIDIA support timestap queries since GeForce4 I think. ATI since 2xxx IIRC.
#### [kore3d]( "kore3d@gmail.com") -
Timestamp and Disjoint doesn’t work with lower feature levels (i.e. 9.3) at the D3D11. Lower levels support events and occlussions only.
